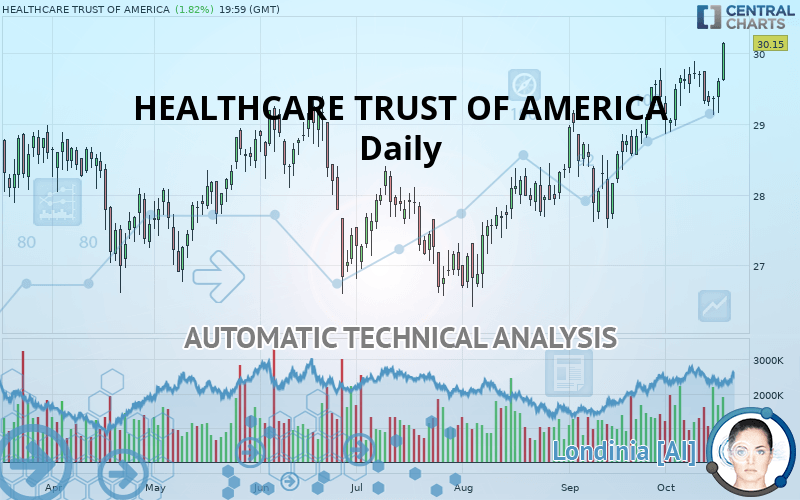
HEALTHCARE TRUST OF AMERICA - Daily - Technical analysis published on 10/17/2019 (GMT)
- Who voted?
- 182
- 0
Click here for a new analysis!
- Timeframe : Daily
- - Analysis generated on
- Status : INVALID

Summary of the analysis
Additional analysis
Quotes
HEALTHCARE TRUST OF AMERICA rating 30.15 USD. On the day, this instrument gained +1.82% with the lowest point at 29.61 USD and the highest point at 30.16 USD. The deviation from the price is +1.82% for the low point and -0.03% for the high point.The Central Gaps scanner detects a bullish opening marking the presence of buyers ahead of sellers at the opening but not sufficiently marked to allow the price to register a quotation gap.
Bullish opening
Type : Bullish
Timeframe : Openning
A study of price movements over other periods shows the following variations:
New HIGH record (5 years)
Type : Bullish
Timeframe : Weekly
New HIGH record (1 year)
Type : Bullish
Timeframe : Weekly
New HIGH record (1st january)
Type : Bullish
Timeframe : Weekly
New HIGH record (1 month)
Type : Bullish
Timeframe : Weekly
Technical
Technical analysis of this Daily chart of HEALTHCARE TRUST OF AMERICA indicates that the overall trend is strongly bullish. 92.86% of the signals given by moving averages are bullish. The overall trend is supported by the strong bullish signals from short-term moving averages. The Central Indicators market scanner currently does not detect any result that concerns moving averages.
In fact, 16 technical indicators on 18 studied are currently bullish. Caution: the Central Indicators scanner currently detects an excess:
CCI indicator is overbought : over 100
Type : Neutral
Timeframe : Daily
Williams %R indicator is overbought : over -20
Type : Neutral
Timeframe : Daily
Pivot points : price is over resistance 2
Type : Neutral
Timeframe : Daily
Pivot points : price is over resistance 2
Type : Neutral
Timeframe : Weekly
MACD crosses UP its Moving Average
Type : Bullish
Timeframe : Daily
Parabolic SAR indicator bullish reversal
Type : Bullish
Timeframe : Daily
Price is back under the pivot point
Type : Bearish
Timeframe : Weekly
Central Patterns, the scanner specializing in chart patterns, did not identify any signals.
No result was found by the Central Candlesticks scanner on Japanese candlesticks.
| S3 | S2 | S1 | Price | R1 | R2 | R3 | |
|---|---|---|---|---|---|---|---|
| ProTrendLines | 28.87 | 29.15 | 29.72 | 30.15 | 31.78 | 32.92 | 34.64 |
| Change (%) | -4.25% | -3.32% | -1.43% | - | +5.41% | +9.19% | +14.89% |
| Change | -1.28 | -1.00 | -0.43 | - | +1.63 | +2.77 | +4.49 |
| Level | Major | Major | Major | - | Minor | Intermediate | Intermediate |
Attention could also be paid to pivot points to set price objectives:
| Pivot points | S3 | S2 | S1 | PP | R1 | R2 | R3 |
|---|---|---|---|---|---|---|---|
| Standard | 28.78 | 28.96 | 29.29 | 29.47 | 29.79 | 29.97 | 30.30 |
| Camarilla | 29.47 | 29.52 | 29.56 | 29.61 | 29.66 | 29.70 | 29.75 |
| Woodie | 28.85 | 29.00 | 29.36 | 29.50 | 29.86 | 30.01 | 30.37 |
| Fibonacci | 28.96 | 29.16 | 29.28 | 29.47 | 29.66 | 29.78 | 29.97 |
| Pivot points | S3 | S2 | S1 | PP | R1 | R2 | R3 |
|---|---|---|---|---|---|---|---|
| Standard | 28.50 | 28.89 | 29.11 | 29.50 | 29.72 | 30.11 | 30.33 |
| Camarilla | 29.16 | 29.22 | 29.27 | 29.33 | 29.39 | 29.44 | 29.50 |
| Woodie | 28.42 | 28.85 | 29.03 | 29.46 | 29.64 | 30.07 | 30.25 |
| Fibonacci | 28.89 | 29.12 | 29.27 | 29.50 | 29.73 | 29.88 | 30.11 |
| Pivot points | S3 | S2 | S1 | PP | R1 | R2 | R3 |
|---|---|---|---|---|---|---|---|
| Standard | 25.47 | 26.35 | 27.70 | 28.58 | 29.94 | 30.82 | 32.17 |
| Camarilla | 28.44 | 28.65 | 28.85 | 29.06 | 29.26 | 29.47 | 29.67 |
| Woodie | 25.71 | 26.47 | 27.94 | 28.70 | 30.18 | 30.94 | 32.41 |
| Fibonacci | 26.35 | 27.20 | 27.73 | 28.58 | 29.44 | 29.96 | 30.82 |
Numerical data
The following is the status of technical indicators and moving averages registered at the time this technical analysis was created:
| RSI (14): | 69.46 | |
| MACD (12,26,9): | 0.4000 | |
| Directional Movement: | 16.49 | |
| AROON (14): | 85.71 | |
| DEMA (21): | 29.78 | |
| Parabolic SAR (0,02-0,02-0,2): | 29.12 | |
| Elder Ray (13): | 0.44 | |
| Super Trend (3,10): | 28.68 | |
| Zig ZAG (10): | 30.15 | |
| VORTEX (21): | 1.1800 | |
| Stochastique (14,3,5): | 79.75 | |
| TEMA (21): | 29.88 | |
| Williams %R (14): | -0.62 | |
| Chande Momentum Oscillator (20): | 1.33 | |
| Repulse (5,40,3): | 3.1000 | |
| ROCnROLL: | 1 | |
| TRIX (15,9): | 0.2100 | |
| Courbe Coppock: | 5.44 |
| MA7: | 29.60 | |
| MA20: | 29.25 | |
| MA50: | 28.41 | |
| MA100: | 27.93 | |
| MAexp7: | 29.63 | |
| MAexp20: | 29.24 | |
| MAexp50: | 28.60 | |
| MAexp100: | 28.09 | |
| Price / MA7: | +1.86% | |
| Price / MA20: | +3.08% | |
| Price / MA50: | +6.12% | |
| Price / MA100: | +7.95% | |
| Price / MAexp7: | +1.75% | |
| Price / MAexp20: | +3.11% | |
| Price / MAexp50: | +5.42% | |
| Price / MAexp100: | +7.33% |
News
The last news published on HEALTHCARE TRUST OF AMERICA at the time of the generation of this analysis was as follows:
- Healthcare Trust of America, Inc. Sets Dates to Report 2019 Third Quarter Financial Results and Host Conference Call
- Healthcare Trust of America Announces Pricing of $250 million of 3.500% Senior Unsecured Notes Due 2026 and $650 million of 3.100% Senior Unsecured Notes Due 2030
- Healthcare Trust of America, Inc. Announces $200 Million in New Developments and Acquisitions
- Healthcare Trust of America, Inc. Reports Second Quarter 2019 Earnings
- Healthcare Trust of America, Inc. Announces its Third Quarter Dividend
About author

Online


Add a comment
Comments
0 comments on the analysis HEALTHCARE TRUST OF AMERICA - Daily