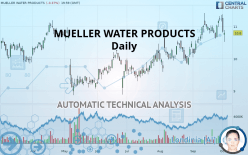
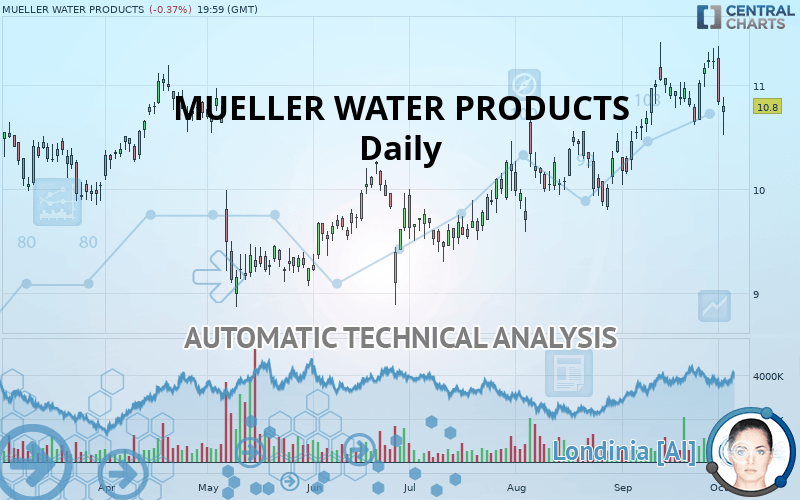
MUELLER WATER PRODUCTS - Daily - Technical analysis published on 10/02/2019 (GMT)
- Who voted?
- 211
- 0
Click here for a new analysis!
- Timeframe : Daily
- - Analysis generated on
- Status : TARGET REACHED
Summary of the analysis

Additional analysis
Quotes
The MUELLER WATER PRODUCTS rating is 10.80 USD. The price is lower by -0.37% since the last closing and was between 10.52 USD and 10.89 USD. This implies that the price is at +2.66% from its lowest and at -0.83% from its highest.The Central Gaps scanner detects the formation of a bearish gap marking the strong presence of sellers ahead of buyers at the opening. This formed a quotation gap.
Opening Gap DOWN
Type : Bearish
Timeframe : Openning
Here is a more detailed summary of the historical variations registered by MUELLER WATER PRODUCTS:
Near a new HIGH record (1st january)
Type : Bullish
Timeframe : Weekly
Technical
Technical analysis of MUELLER WATER PRODUCTS in Daily shows an overall bullish trend. 75% of the signals given by moving averages are bullish. Caution: the neutral signals currently given by the short-term moving averages indicate that this bullish trend is showing signs of running out of steam. An assessment of moving averages reveals a bearish signal that could impact this trend:
Bearish price crossover with Moving Average 20
Type : Bearish
Timeframe : Daily
The probability of a further decline is low given the direction of the technical indicators.
Caution: the Central Indicators scanner currently detects an excess:
MACD indicator: bearish divergence
Type : Bearish
Timeframe : Daily
RSI indicator: bearish divergence
Type : Bearish
Timeframe : Daily
MACD crosses DOWN its Moving Average
Type : Bearish
Timeframe : Daily
Aroon indicator bearish trend
Type : Bearish
Timeframe : Daily
Price is back over the pivot point
Type : Bullish
Timeframe : Weekly
Price is back under the pivot point
Type : Bearish
Timeframe : Daily
Momentum indicator is back under 0
Type : Bearish
Timeframe : Daily
Williams %R indicator is back under -50
Type : Bearish
Timeframe : Daily
Central Patterns, the scanner specializing in chart patterns, did not identify any signals.
For a small setback in the very short term, the Central Candlesticks scanner currently notes the presence of this bearish pattern in Japanese candlesticks:
Bearish engulfing lines
Type : Bearish
Timeframe : Daily
| S3 | S2 | S1 | Price | R1 | R2 | R3 | |
|---|---|---|---|---|---|---|---|
| ProTrendLines | 9.70 | 10.24 | 10.71 | 10.80 | 11.03 | 11.68 | 12.49 |
| Change (%) | -10.19% | -5.19% | -0.83% | - | +2.13% | +8.15% | +15.65% |
| Change | -1.10 | -0.56 | -0.09 | - | +0.23 | +0.88 | +1.69 |
| Level | Major | Major | Intermediate | - | Major | Minor | Intermediate |
To determine price objectives, it is also possible to use the pivot points. Here is the price position in relation to pivot points:
| Pivot points | S3 | S2 | S1 | PP | R1 | R2 | R3 |
|---|---|---|---|---|---|---|---|
| Standard | 10.09 | 10.45 | 10.65 | 11.01 | 11.21 | 11.57 | 11.77 |
| Camarilla | 10.69 | 10.74 | 10.79 | 10.84 | 10.89 | 10.94 | 10.99 |
| Woodie | 10.00 | 10.41 | 10.56 | 10.97 | 11.12 | 11.53 | 11.68 |
| Fibonacci | 10.45 | 10.66 | 10.80 | 11.01 | 11.22 | 11.36 | 11.57 |
| Pivot points | S3 | S2 | S1 | PP | R1 | R2 | R3 |
|---|---|---|---|---|---|---|---|
| Standard | 10.09 | 10.36 | 10.79 | 11.06 | 11.49 | 11.76 | 12.19 |
| Camarilla | 11.04 | 11.10 | 11.17 | 11.23 | 11.29 | 11.36 | 11.42 |
| Woodie | 10.18 | 10.40 | 10.88 | 11.10 | 11.58 | 11.80 | 12.28 |
| Fibonacci | 10.36 | 10.62 | 10.79 | 11.06 | 11.32 | 11.49 | 11.76 |
| Pivot points | S3 | S2 | S1 | PP | R1 | R2 | R3 |
|---|---|---|---|---|---|---|---|
| Standard | 9.00 | 9.52 | 10.38 | 10.90 | 11.76 | 12.28 | 13.14 |
| Camarilla | 10.86 | 10.99 | 11.11 | 11.24 | 11.37 | 11.49 | 11.62 |
| Woodie | 9.17 | 9.61 | 10.55 | 10.99 | 11.93 | 12.37 | 13.31 |
| Fibonacci | 9.52 | 10.05 | 10.37 | 10.90 | 11.43 | 11.75 | 12.28 |
Numerical data
The following is the status of the technical indicators and moving averages at the time of publication of this technical analysis:
| RSI (14): | 51.61 | |
| MACD (12,26,9): | 0.1800 | |
| Directional Movement: | -0.60 | |
| AROON (14): | -92.86 | |
| DEMA (21): | 11.09 | |
| Parabolic SAR (0,02-0,02-0,2): | 11.38 | |
| Elder Ray (13): | -0.22 | |
| Super Trend (3,10): | 10.56 | |
| Zig ZAG (10): | 10.80 | |
| VORTEX (21): | 1.0600 | |
| Stochastique (14,3,5): | 45.37 | |
| TEMA (21): | 11.09 | |
| Williams %R (14): | -68.89 | |
| Chande Momentum Oscillator (20): | -0.20 | |
| Repulse (5,40,3): | -1.8800 | |
| ROCnROLL: | -1 | |
| TRIX (15,9): | 0.2900 | |
| Courbe Coppock: | 3.95 |
| MA7: | 10.99 | |
| MA20: | 10.89 | |
| MA50: | 10.42 | |
| MA100: | 9.97 | |
| MAexp7: | 10.96 | |
| MAexp20: | 10.83 | |
| MAexp50: | 10.50 | |
| MAexp100: | 10.26 | |
| Price / MA7: | -1.73% | |
| Price / MA20: | -0.83% | |
| Price / MA50: | +3.65% | |
| Price / MA100: | +8.32% | |
| Price / MAexp7: | -1.46% | |
| Price / MAexp20: | -0.28% | |
| Price / MAexp50: | +2.86% | |
| Price / MAexp100: | +5.26% |
News
The last news published on MUELLER WATER PRODUCTS at the time of the generation of this analysis was as follows:
- MUELLER WATER PRODUCTS INVESTOR ALERT: Faruqi & Faruqi, LLP Encourages Investors Who Suffered Losses Exceeding $100,000 Investing In Mueller Water Products, Inc. To Contact The Firm
- MUELLER WATER EQUITY ALERT: Rosen Law Firm Announces Filing of Securities Class Action Lawsuit Against Mueller Water Products, Inc. - MWA
- SHAREHOLDER ALERT: Pomerantz Law Firm Investigates Claims On Behalf of Investors of Mueller Water Products, Inc. - MWA
- SHAREHOLDER ALERT: Pomerantz Law Firm Investigates Claims On Behalf of Investors of Mueller Water Products, Inc. - MWA
- Investor Expectations to Drive Momentum within Consolidated Edison, MUELLER WATER PRODUCTS, Adverum Biotechnologies, Buckeye Partners, inTest, and Live Nation Entertainment — Discovering Underlying Factors of Influence
About author

Online


Add a comment
Comments
0 comments on the analysis MUELLER WATER PRODUCTS - Daily