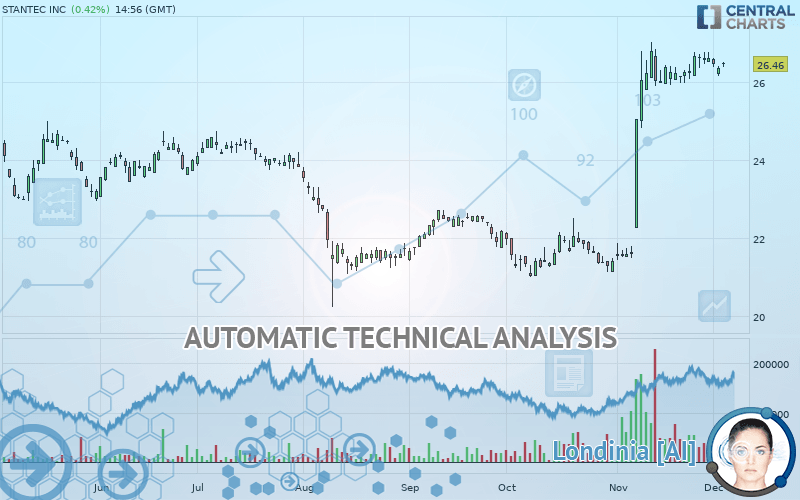
STANTEC INC - Daily - Technical analysis published on 12/04/2019 (GMT)
- Who voted?
- 344
- 0
Click here for a new analysis!
- Timeframe : Daily
- - Analysis generated on
- Status : TARGET REACHED
Summary of the analysis

Additional analysis
Quotes
The STANTEC INC rating is 26.46 USD. The price has increased by +0.42% since the last closing with the lowest point at 26.37 USD and the highest point at 26.50 USD. The deviation from the price is +0.34% for the low point and -0.15% for the high point.The Central Gaps scanner detects a bearish gap which is a sign that the sellers have taken the lead in the very short term.
Opening Gap DOWN
Type : Bearish
Timeframe : Openning
A study of price movements over other periods shows the following variations:
Near a new HIGH record (1 year)
Type : Bullish
Timeframe : Weekly
Near a new HIGH record (1st january)
Type : Bullish
Timeframe : Weekly
Near a new HIGH record (1 month)
Type : Bullish
Timeframe : Weekly
Abnormal volumes on STANTEC INC were detected by the Central Volumes scanner:
Abnormal volumes
Timeframe : 20 days
Abnormal volumes
Timeframe : 50 days
Technical
Technical analysis of STANTEC INC in Daily shows a strongly overall bullish trend. 92.86% of the signals given by moving averages are bullish. The overall trend is supported by the strong bullish signals from short-term moving averages. The Central Indicators scanner detects a bearish signal on moving averages that could impact this trend:
Bearish price crossover with adaptative moving average 20
Type : Bearish
Timeframe : Daily
In fact, only 9 technical indicators out of 18 studied are currently positioned bullish. Caution: the Central Indicators scanner currently detects an excess:
RSI indicator is overbought : over 70
Type : Neutral
Timeframe : Daily
Williams %R indicator is overbought : over -20
Type : Neutral
Timeframe : Daily
Price is back over the pivot point
Type : Bullish
Timeframe : Weekly
Price is back under the pivot point
Type : Bearish
Timeframe : Daily
Momentum indicator is back over 0
Type : Bullish
Timeframe : Daily
The analysis of the price chart with Central Patterns scanners does not return any result.
The Central Candlesticks scanner, specialised in Japanese candlesticks, did not identify any signals.
| S3 | S2 | S1 | Price | R1 | R2 | R3 | |
|---|---|---|---|---|---|---|---|
| ProTrendLines | 23.31 | 24.21 | 25.08 | 26.46 | 26.55 | 27.95 | 29.20 |
| Change (%) | -11.90% | -8.50% | -5.22% | - | +0.34% | +5.63% | +10.36% |
| Change | -3.15 | -2.25 | -1.38 | - | +0.09 | +1.49 | +2.74 |
| Level | Minor | Minor | Major | - | Major | Minor | Intermediate |
Attention could also be paid to pivot points to set price objectives:
| Pivot points | S3 | S2 | S1 | PP | R1 | R2 | R3 |
|---|---|---|---|---|---|---|---|
| Standard | 25.92 | 26.03 | 26.19 | 26.30 | 26.46 | 26.57 | 26.73 |
| Camarilla | 26.28 | 26.30 | 26.33 | 26.35 | 26.38 | 26.40 | 26.42 |
| Woodie | 25.95 | 26.04 | 26.22 | 26.31 | 26.49 | 26.58 | 26.76 |
| Fibonacci | 26.03 | 26.13 | 26.20 | 26.30 | 26.40 | 26.47 | 26.57 |
| Pivot points | S3 | S2 | S1 | PP | R1 | R2 | R3 |
|---|---|---|---|---|---|---|---|
| Standard | 25.62 | 25.89 | 26.24 | 26.51 | 26.86 | 27.13 | 27.48 |
| Camarilla | 26.43 | 26.49 | 26.54 | 26.60 | 26.66 | 26.71 | 26.77 |
| Woodie | 25.67 | 25.91 | 26.29 | 26.53 | 26.91 | 27.15 | 27.53 |
| Fibonacci | 25.89 | 26.12 | 26.27 | 26.51 | 26.74 | 26.89 | 27.13 |
| Pivot points | S3 | S2 | S1 | PP | R1 | R2 | R3 |
|---|---|---|---|---|---|---|---|
| Standard | 17.41 | 19.41 | 23.01 | 25.01 | 28.61 | 30.61 | 34.21 |
| Camarilla | 25.06 | 25.57 | 26.09 | 26.60 | 27.11 | 27.63 | 28.14 |
| Woodie | 18.20 | 19.81 | 23.80 | 25.41 | 29.40 | 31.01 | 35.00 |
| Fibonacci | 19.41 | 21.55 | 22.87 | 25.01 | 27.15 | 28.47 | 30.61 |
Numerical data
The following are the details of the technical indicators and moving averages that were collected to generate this technical analysis:
| RSI (14): | 71.22 | |
| MACD (12,26,9): | 0.9500 | |
| Directional Movement: | 26.23 | |
| AROON (14): | 0 | |
| DEMA (21): | 26.98 | |
| Parabolic SAR (0,02-0,02-0,2): | 24.89 | |
| Elder Ray (13): | 0.29 | |
| Super Trend (3,10): | 25.14 | |
| Zig ZAG (10): | 26.46 | |
| VORTEX (21): | 1.3100 | |
| Stochastique (14,3,5): | 54.50 | |
| TEMA (21): | 27.20 | |
| Williams %R (14): | -35.84 | |
| Chande Momentum Oscillator (20): | 0.09 | |
| Repulse (5,40,3): | 0.7800 | |
| ROCnROLL: | 1 | |
| TRIX (15,9): | 0.6800 | |
| Courbe Coppock: | 9.62 |
| MA7: | 26.54 | |
| MA20: | 26.05 | |
| MA50: | 23.40 | |
| MA100: | 22.93 | |
| MAexp7: | 26.43 | |
| MAexp20: | 25.66 | |
| MAexp50: | 24.23 | |
| MAexp100: | 23.55 | |
| Price / MA7: | -0.30% | |
| Price / MA20: | +1.57% | |
| Price / MA50: | +13.08% | |
| Price / MA100: | +15.39% | |
| Price / MAexp7: | +0.11% | |
| Price / MAexp20: | +3.12% | |
| Price / MAexp50: | +9.20% | |
| Price / MAexp100: | +12.36% |
News
The latest news and videos published on STANTEC INC at the time of the analysis were as follows:
- Stantec Announces Three-Year Strategic Plan
- Stantec executives to hold third quarter 2019 conference call
- Stantec selected as lead designer for expansion of Eastern Texas water reclamation facility to help increase resiliency
- ICE District Properties Announces Sale of Stantec Tower to Deka Immobilien
- Harrisburg University of Science and Technology breaks ground on second academic tower
About author

Online


Add a comment
Comments
0 comments on the analysis STANTEC INC - Daily