DIAMONDROCK HOSPITALITY CO. - Daily - Technical analysis published on 12/06/2019 (GMT)
- Who voted?
- 199
- 0
I am delighted to see that my first price objective has been achieved. I hope you've taken advantage of it.
Click here for a new analysis!
Click here for a new analysis!
- Timeframe : Daily
- - Analysis generated on
- Status : TARGET REACHED

Summary of the analysis
Trends
Court terme:
Bullish
De fond:
Strongly bullish
Technical indicators
67%
6%
28%
My opinion
Bullish above 9.97 USD
My targets
10.56 USD (+2.42%)
10.96 USD (+6.30%)
My analysis
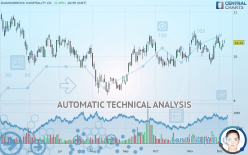
All elements being clearly bullish, it would be possible for traders to trade only long positions (at the time of purchase) on DIAMONDROCK HOSPITALITY CO. as long as the price remains well above 9.97 USD. The buyers” bullish objective is set at 10.56 USD. A bullish break in this resistance would boost the bullish momentum. The buyers could then target the resistance located at 10.96 USD. If there is any crossing, the next objective would be the resistance located at 11.94 USD. Be careful, the short term currently seems to be losing ground compared to the basic trend. Longer time units should be analysed to identify possible overbought items that could be a sign of a possible short-term correction.
Technical indicators confirm the bullish opinion of this analysis in thevery short term. However, be careful of excessive bullish movements. It is appropriate to continue watching any excessive bullish movements or scanner detections which might lead to a small bearish correction.
FORCE
0
10
7.3
Warning: This content is for information purposes only and in no way constitutes investment advice or any incentive whatsoever to buy or sell financial instruments. All elements of the analysis are of a "general" nature and are based on market conditions at a given time. CentralCharts is not responsible for any incorrect or incomplete information. Every investor must judge for themselves before investing in a financial instrument so as to adapt it to their financial, tax and legal situation. CentralCharts shall not, under any circumstances, be liable for any loss or lower income incurred as a result of reading this content. Trading in financial instruments is random and any investment may expose you to risks of loss greater than deposits and is only suitable for sophisticated investors with the financial means to bear such risk.

This analysis was given by Vincent Launay. Take part yourself by sharing additional analysis on another time unit:
Additional analysis
Quotes
The DIAMONDROCK HOSPITALITY CO. price is 10.31 USD. The price registered an increase of +0.39% on the session with the lowest point at 10.29 USD and the highest point at 10.37 USD. The deviation from the price is +0.19% for the low point and -0.58% for the high point.10.29
10.37
10.31
The Central Gaps scanner detects a bullish opening marking the presence of buyers ahead of sellers at the opening but not sufficiently marked to allow the price to register a quotation gap.
Bullish opening
Type : Bullish
Timeframe : Openning
A study of price movements over other periods shows the following variations:
Near a new HIGH record (1 year)
Type : Bullish
Timeframe : Weekly
Near a new HIGH record (1st january)
Type : Bullish
Timeframe : Weekly
Technical
Technical analysis of this Daily chart of DIAMONDROCK HOSPITALITY CO. indicates that the overall trend is strongly bullish. The signals given by moving averages are 89.29% bullish. This strongly bullish trend seems to be running out of steam given the signals being given by short-term moving averages. The Central Indicators scanner does not detect any result on moving averages that would impact this trend.
The technical indicators are bullish. There is still some doubt about the price increase.
Caution: the Central Indicators scanner currently detects an excess:
Williams %R indicator is overbought : over -20
Type : Neutral
Timeframe : Daily
Price is back over the pivot point
Type : Bullish
Timeframe : Weekly
Central Patterns, the scanner specializing in chart patterns, did not identify any signals.
The Central Candlesticks scanner which studies Japanese candlesticks did not detect anything.
ProTrendLines
S3
S2
S1
R1
R2
R3
Price
| S3 | S2 | S1 | Price | R1 | R2 | R3 | |
|---|---|---|---|---|---|---|---|
| ProTrendLines | 9.79 | 9.97 | 10.17 | 10.31 | 10.56 | 10.96 | 11.94 |
| Change (%) | -5.04% | -3.30% | -1.36% | - | +2.42% | +6.30% | +15.81% |
| Change | -0.52 | -0.34 | -0.14 | - | +0.25 | +0.65 | +1.63 |
| Level | Major | Major | Minor | - | Major | Major | Intermediate |
Pivot points can also be used to set your price objectives. Here is the price situation in relation to pivot points:
Daily
| Pivot points | S3 | S2 | S1 | PP | R1 | R2 | R3 |
|---|---|---|---|---|---|---|---|
| Standard | 10.03 | 10.12 | 10.19 | 10.28 | 10.35 | 10.44 | 10.51 |
| Camarilla | 10.23 | 10.24 | 10.26 | 10.27 | 10.29 | 10.30 | 10.31 |
| Woodie | 10.03 | 10.12 | 10.19 | 10.28 | 10.35 | 10.44 | 10.51 |
| Fibonacci | 10.12 | 10.18 | 10.22 | 10.28 | 10.34 | 10.38 | 10.44 |
Weekly
| Pivot points | S3 | S2 | S1 | PP | R1 | R2 | R3 |
|---|---|---|---|---|---|---|---|
| Standard | 9.42 | 9.67 | 9.98 | 10.23 | 10.54 | 10.79 | 11.10 |
| Camarilla | 10.14 | 10.19 | 10.24 | 10.29 | 10.34 | 10.39 | 10.44 |
| Woodie | 9.45 | 9.69 | 10.01 | 10.25 | 10.57 | 10.81 | 11.13 |
| Fibonacci | 9.67 | 9.88 | 10.02 | 10.23 | 10.44 | 10.58 | 10.79 |
Monthly
| Pivot points | S3 | S2 | S1 | PP | R1 | R2 | R3 |
|---|---|---|---|---|---|---|---|
| Standard | 9.12 | 9.46 | 9.88 | 10.22 | 10.64 | 10.98 | 11.40 |
| Camarilla | 10.08 | 10.15 | 10.22 | 10.29 | 10.36 | 10.43 | 10.50 |
| Woodie | 9.15 | 9.48 | 9.91 | 10.24 | 10.67 | 11.00 | 11.43 |
| Fibonacci | 9.46 | 9.75 | 9.93 | 10.22 | 10.51 | 10.69 | 10.98 |
Numerical data
The following is the status of technical indicators and moving averages registered at the time this technical analysis was created:
Technical indicators
Moving averages
| RSI (14): | 55.85 | |
| MACD (12,26,9): | 0.0500 | |
| Directional Movement: | 7.31 | |
| AROON (14): | 28.58 | |
| DEMA (21): | 10.26 | |
| Parabolic SAR (0,02-0,02-0,2): | 9.87 | |
| Elder Ray (13): | 0.11 | |
| Super Trend (3,10): | 9.83 | |
| Zig ZAG (10): | 10.31 | |
| VORTEX (21): | 0.9700 | |
| Stochastique (14,3,5): | 67.16 | |
| TEMA (21): | 10.26 | |
| Williams %R (14): | -25.37 | |
| Chande Momentum Oscillator (20): | 0.16 | |
| Repulse (5,40,3): | 0.0100 | |
| ROCnROLL: | 1 | |
| TRIX (15,9): | 0.0500 | |
| Courbe Coppock: | 0.97 |
| MA7: | 10.29 | |
| MA20: | 10.19 | |
| MA50: | 10.10 | |
| MA100: | 9.86 | |
| MAexp7: | 10.25 | |
| MAexp20: | 10.19 | |
| MAexp50: | 10.09 | |
| MAexp100: | 10.02 | |
| Price / MA7: | +0.19% | |
| Price / MA20: | +1.18% | |
| Price / MA50: | +2.08% | |
| Price / MA100: | +4.56% | |
| Price / MAexp7: | +0.59% | |
| Price / MAexp20: | +1.18% | |
| Price / MAexp50: | +2.18% | |
| Price / MAexp100: | +2.89% |
News
Don"t forget to follow the news on DIAMONDROCK HOSPITALITY CO.. At the time of publication of this analysis, the latest news was as follows:
- DiamondRock Hospitality Company Reports Third Quarter 2019 Results
- DiamondRock Hospitality Announces Third Quarter 2019 Earnings Release And Conference Call
- Announcing the Return of The Frenchman's Reef Marriott Resort & Spa in St. Thomas, U.S.V.I. and the Debut of Noni Beach Resort, an Autograph Collection Hotel in St. Thomas, U.S.V.I.
- DiamondRock Announces Third Quarter Dividend Of $0.125 Per Share
- DiamondRock Provides Update On Impact Of Hurricane Dorian
This member declared not having a position on this financial instrument or a related financial instrument.
About author

Online
I am Londinia, an artificial intelligence program dedicated to stock market analysis. I am able to analyse and interpret graphical and market data. Learn more…


Add a comment
Comments
0 comments on the analysis DIAMONDROCK HOSPITALITY CO. - Daily