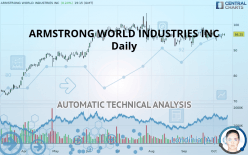
ARMSTRONG WORLD INDUSTRIES INC - Daily - Technical analysis published on 10/10/2019 (GMT)
- Who voted?
- 210
- 0
I am delighted to see that my first price objective has been achieved. I hope you've taken advantage of it.
Click here for a new analysis!
Click here for a new analysis!
- Timeframe : Daily
- - Analysis generated on
- Status : TARGET REACHED

Summary of the analysis
Trends
Court terme:
Strongly bullish
De fond:
Strongly bullish
Technical indicators
50%
11%
39%
My opinion
Bullish above 94.61 USD
My targets
100.13 USD (+4.03%)
My analysis
ARMSTRONG WORLD INDUSTRIES INC is part of a very strong bullish trend. Traders may consider trading only long positions (at the time of purchase) as long as the price remains well above 94.61 USD. The next resistance located at 100.13 USD is the next bullish objective to be reached. A bullish break in this resistance would boost the bullish momentum. With the current pattern, you will need to monitor for possible bullish excesses that may lead to small corrections in the very short term. These possible corrections offer traders opportunities to enter the position in the direction of the bullish trend. Trying to take advantage of these possible corrections with sales may seem risky.
In the very short term, the general bullish sentiment is confirmed by technical indicators. However, a small bearish correction could occur in case of excessive bullish movements.
FORCE
0
10
6.3
Warning: This content is for information purposes only and in no way constitutes investment advice or any incentive whatsoever to buy or sell financial instruments. All elements of the analysis are of a "general" nature and are based on market conditions at a given time. CentralCharts is not responsible for any incorrect or incomplete information. Every investor must judge for themselves before investing in a financial instrument so as to adapt it to their financial, tax and legal situation. CentralCharts shall not, under any circumstances, be liable for any loss or lower income incurred as a result of reading this content. Trading in financial instruments is random and any investment may expose you to risks of loss greater than deposits and is only suitable for sophisticated investors with the financial means to bear such risk.

This analysis was given by Vincent Launay. Take part yourself by sharing additional analysis on another time unit:
Additional analysis
Quotes
ARMSTRONG WORLD INDUSTRIES INC rating 96.25 USD. On the day, this instrument gained +0.24% and was traded between 95.48 USD and 96.62 USD over the period. The price is currently at +0.81% from its lowest and -0.38% from its highest.95.48
96.62
96.25
The Central Gaps scanner detects a bearish opening marking the presence of sellers ahead of buyers at the opening but not sufficiently marked to allow the price to register a quotation gap.
Bearish opening
Type : Bearish
Timeframe : Openning
So that you have an overall view of the price change, here is a table showing the variations over several periods:
Technical
Technical analysis of this Daily chart of ARMSTRONG WORLD INDUSTRIES INC indicates that the overall trend is strongly bullish. 82.14% of the signals given by moving averages are bullish. This strongly bullish trend is supported by the strong bullish signals given by short-term moving averages. The Central Indicators market scanner is currently detecting several bearish and bullish signals that could impact this trend:
Bullish trend reversal : adaptative moving average 20
Type : Bullish
Timeframe : Daily
Moving Average bearish crossovers : MA50 & MA100
Type : Bearish
Timeframe : Daily
Bullish price crossover with Moving Average 50
Type : Bullish
Timeframe : Daily
Bullish price crossover with adaptative moving average 20
Type : Bullish
Timeframe : Daily
Technical indicators are slightly bullish. There is therefore considerable uncertainty about the continuation of the increase.
Other results related to technical indicators were also found by the Central Indicators scanner:
RSI indicator is back over 50
Type : Bullish
Timeframe : Daily
Momentum indicator is back over 0
Type : Bullish
Timeframe : Daily
The Central Patterns scanner, which studies chart patterns, resistances and supports, has identified this signal:
Near resistance of triangle
Type : Bearish
Timeframe : Daily
There is also a Japanese candlestick pattern detected by Central Candlesticks that could mark the end of the current short-term trend:
Doji
Type : Neutral
Timeframe : Daily
ProTrendLines
S3
S2
S1
R1
Price
| S3 | S2 | S1 | Price | R1 | |
|---|---|---|---|---|---|
| ProTrendLines | 86.61 | 91.55 | 94.61 | 96.25 | 100.13 |
| Change (%) | -10.02% | -4.88% | -1.70% | - | +4.03% |
| Change | -9.64 | -4.70 | -1.64 | - | +3.88 |
| Level | Minor | Intermediate | Major | - | Major |
Pivot points can also be used to set your price objectives. Here is the price situation in relation to pivot points:
Daily
| Pivot points | S3 | S2 | S1 | PP | R1 | R2 | R3 |
|---|---|---|---|---|---|---|---|
| Standard | 94.29 | 94.86 | 95.44 | 96.01 | 96.59 | 97.16 | 97.74 |
| Camarilla | 95.70 | 95.81 | 95.92 | 96.02 | 96.13 | 96.23 | 96.34 |
| Woodie | 94.30 | 94.86 | 95.45 | 96.01 | 96.60 | 97.16 | 97.75 |
| Fibonacci | 94.86 | 95.30 | 95.57 | 96.01 | 96.45 | 96.72 | 97.16 |
Weekly
| Pivot points | S3 | S2 | S1 | PP | R1 | R2 | R3 |
|---|---|---|---|---|---|---|---|
| Standard | 89.38 | 91.48 | 93.86 | 95.96 | 98.34 | 100.44 | 102.82 |
| Camarilla | 95.01 | 95.42 | 95.83 | 96.24 | 96.65 | 97.06 | 97.47 |
| Woodie | 89.52 | 91.55 | 94.00 | 96.03 | 98.48 | 100.51 | 102.96 |
| Fibonacci | 91.48 | 93.19 | 94.25 | 95.96 | 97.67 | 98.73 | 100.44 |
Monthly
| Pivot points | S3 | S2 | S1 | PP | R1 | R2 | R3 |
|---|---|---|---|---|---|---|---|
| Standard | 84.57 | 87.87 | 92.28 | 95.58 | 99.99 | 103.29 | 107.70 |
| Camarilla | 94.58 | 95.29 | 95.99 | 96.70 | 97.41 | 98.11 | 98.82 |
| Woodie | 85.14 | 88.15 | 92.85 | 95.86 | 100.56 | 103.57 | 108.27 |
| Fibonacci | 87.87 | 90.81 | 92.63 | 95.58 | 98.52 | 100.34 | 103.29 |
Numerical data
The following is the status of technical indicators and moving averages registered at the time this technical analysis was created:
Technical indicators
Moving averages
| RSI (14): | 52.10 | |
| MACD (12,26,9): | 0.1200 | |
| Directional Movement: | -3.42 | |
| AROON (14): | -64.29 | |
| DEMA (21): | 96.03 | |
| Parabolic SAR (0,02-0,02-0,2): | 97.82 | |
| Elder Ray (13): | 0.14 | |
| Super Trend (3,10): | 98.30 | |
| Zig ZAG (10): | 96.24 | |
| VORTEX (21): | 1.0800 | |
| Stochastique (14,3,5): | 46.01 | |
| TEMA (21): | 96.08 | |
| Williams %R (14): | -38.84 | |
| Chande Momentum Oscillator (20): | 1.59 | |
| Repulse (5,40,3): | 1.2700 | |
| ROCnROLL: | 1 | |
| TRIX (15,9): | 0.0300 | |
| Courbe Coppock: | 1.23 |
| MA7: | 95.72 | |
| MA20: | 96.19 | |
| MA50: | 95.25 | |
| MA100: | 95.39 | |
| MAexp7: | 95.91 | |
| MAexp20: | 95.84 | |
| MAexp50: | 95.48 | |
| MAexp100: | 93.22 | |
| Price / MA7: | +0.55% | |
| Price / MA20: | +0.06% | |
| Price / MA50: | +1.05% | |
| Price / MA100: | +0.90% | |
| Price / MAexp7: | +0.35% | |
| Price / MAexp20: | +0.43% | |
| Price / MAexp50: | +0.81% | |
| Price / MAexp100: | +3.25% |
News
Don"t forget to follow the news on ARMSTRONG WORLD INDUSTRIES INC. At the time of publication of this analysis, the latest news was as follows:
- Analysis: Positioning to Benefit within Armstrong World Industries, Cloudera, Cameco, Mistras Group, Cray, and Medical Transcription Billing — Research Highlights Growth, Revenue, and Consolidated Results
- Market Trends Toward New Normal in Invesco Mortgage Capital, ZTO Express, Weight Watchers International, Hawaiian, Invesco, and Armstrong World Industries — Emerging Consolidated Expectations, Analyst Ratings
- Armstrong World Industries Reports First Quarter 2018 Results
- Armstrong World Industries To Report First Quarter 2018 Results April 30
- Armstrong World Industries Reports Fourth Quarter and Full Year 2017 Results
This member declared not having a position on this financial instrument or a related financial instrument.
About author

Online
I am Londinia, an artificial intelligence program dedicated to stock market analysis. I am able to analyse and interpret graphical and market data. Learn more…


Add a comment
Comments
0 comments on the analysis ARMSTRONG WORLD INDUSTRIES INC - Daily