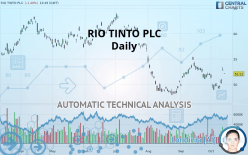
RIO TINTO PLC - Daily - Technical analysis published on 10/14/2019 (GMT)
- Who voted?
- 263
- 0
Click here for a new analysis!
- Timeframe : Daily
- - Analysis generated on
- Status : TARGET REACHED

Summary of the analysis

Additional analysis
Quotes
RIO TINTO PLC rating 52.11 USD. On the day, this instrument lost -1.40% and was between 52.06 USD and 52.23 USD. This implies that the price is at +0.10% from its lowest and at -0.23% from its highest.A bearish opening was detected by the Central Gaps scanner. Sellers are trying to impose a bearish trend in the very short term.
Bearish opening
Type : Bearish
Timeframe : Openning
Opening Gap UP
Type : Bullish
Timeframe : Openning
Here is a more detailed summary of the historical variations registered by RIO TINTO PLC:
Technical
A technical analysis in Daily of this RIO TINTO PLC chart shows a slightly bullish trend. 53.57% of the signals given by moving averages are bullish. The slightly bullish signals given by short-term moving averages do not show a strengthening of this global trend. The Central Indicators scanner detects bullish signals on moving averages that could impact this trend:
Bullish price crossover with Moving Average 20
Type : Bullish
Timeframe : Daily
Bullish price crossover with adaptative moving average 20
Type : Bullish
Timeframe : Daily
Bullish price crossover with adaptative moving average 50
Type : Bullish
Timeframe : Daily
In fact, according to the parameters integrated into the Central Analyzer system, 11 technical indicators out of 18 analysed are currently bullish. Caution: the Central Indicators scanner currently detects an excess:
Williams %R indicator is overbought : over -20
Type : Neutral
Timeframe : Daily
Pivot points : price is under support 2
Type : Neutral
Timeframe : Daily
RSI indicator is back over 50
Type : Bullish
Timeframe : Daily
MACD crosses UP its Moving Average
Type : Bullish
Timeframe : Daily
Aroon indicator bullish trend
Type : Bullish
Timeframe : Daily
SuperTrend indicator bullish reversal
Type : Bullish
Timeframe : Daily
Price is back over the pivot point
Type : Bullish
Timeframe : Daily
Price is back under the pivot point
Type : Bearish
Timeframe : Weekly
Momentum indicator is back over 0
Type : Bullish
Timeframe : Daily
Williams %R indicator is back over -50
Type : Bullish
Timeframe : Daily
The Central Patterns scanner, which studies chart patterns, resistances and supports, has identified these signals:
Resistance of channel is broken
Type : Bullish
Timeframe : Daily
Resistance of triangle is broken
Type : Bullish
Timeframe : Daily
From the Japanese candlestick perspective, the Central Candlesticks scanner notes the presence of these results that could impact the short-term trend:
White gravestone / inverted hammer
Type : Neutral
Timeframe : Daily
Upside gap
Type : Bullish
Timeframe : Daily
| S3 | S2 | S1 | Price | R1 | R2 | R3 | |
|---|---|---|---|---|---|---|---|
| ProTrendLines | 40.09 | 46.88 | 49.87 | 52.11 | 52.21 | 54.75 | 57.16 |
| Change (%) | -23.07% | -10.04% | -4.30% | - | +0.19% | +5.07% | +9.69% |
| Change | -12.02 | -5.23 | -2.24 | - | +0.10 | +2.64 | +5.05 |
| Level | Major | Major | Major | - | Major | Major | Intermediate |
Attention could also be paid to pivot points to set price objectives:
| Pivot points | S3 | S2 | S1 | PP | R1 | R2 | R3 |
|---|---|---|---|---|---|---|---|
| Standard | 49.44 | 49.79 | 50.34 | 50.69 | 51.24 | 51.59 | 52.14 |
| Camarilla | 50.65 | 50.74 | 50.82 | 50.90 | 50.98 | 51.07 | 51.15 |
| Woodie | 51.83 | 49.84 | 50.45 | 50.74 | 51.35 | 51.64 | 52.25 |
| Fibonacci | 52.34 | 52.60 | 52.76 | 53.02 | 53.28 | 53.44 | 53.70 |
| Pivot points | S3 | S2 | S1 | PP | R1 | R2 | R3 |
|---|---|---|---|---|---|---|---|
| Standard | 45.40 | 47.17 | 48.66 | 50.43 | 51.91 | 53.69 | 55.17 |
| Camarilla | 49.24 | 49.54 | 49.84 | 50.14 | 50.44 | 50.74 | 51.04 |
| Woodie | 46.37 | 47.10 | 48.51 | 50.36 | 51.77 | 53.61 | 55.03 |
| Fibonacci | 47.48 | 49.13 | 50.15 | 51.80 | 53.45 | 54.47 | 56.12 |
| Pivot points | S3 | S2 | S1 | PP | R1 | R2 | R3 |
|---|---|---|---|---|---|---|---|
| Standard | 43.69 | 46.71 | 49.40 | 52.42 | 55.11 | 58.13 | 60.82 |
| Camarilla | 50.52 | 51.04 | 51.57 | 52.09 | 52.61 | 53.14 | 53.66 |
| Woodie | 43.53 | 46.63 | 49.24 | 52.34 | 54.95 | 58.05 | 60.66 |
| Fibonacci | 46.71 | 48.89 | 50.24 | 52.42 | 54.60 | 55.95 | 58.13 |
Numerical data
The following are the details of the technical indicators and moving averages that were collected to generate this technical analysis:
| RSI (14): | 58.67 | |
| MACD (12,26,9): | -0.3200 | |
| Directional Movement: | 12.28 | |
| AROON (14): | 42.86 | |
| DEMA (21): | 50.76 | |
| Parabolic SAR (0,02-0,02-0,2): | 48.98 | |
| Elder Ray (13): | 2.13 | |
| Super Trend (3,10): | 49.88 | |
| Zig ZAG (10): | 52.11 | |
| VORTEX (21): | 0.7800 | |
| Stochastique (14,3,5): | 68.86 | |
| TEMA (21): | 51.01 | |
| Williams %R (14): | -28.46 | |
| Chande Momentum Oscillator (20): | 0.74 | |
| Repulse (5,40,3): | 0.2700 | |
| ROCnROLL: | -1 | |
| TRIX (15,9): | -0.0700 | |
| Courbe Coppock: | 6.50 |
| MA7: | 50.64 | |
| MA20: | 51.56 | |
| MA50: | 50.74 | |
| MA100: | 54.14 | |
| MAexp7: | 51.20 | |
| MAexp20: | 51.15 | |
| MAexp50: | 51.89 | |
| MAexp100: | 52.76 | |
| Price / MA7: | +2.90% | |
| Price / MA20: | +1.07% | |
| Price / MA50: | +2.70% | |
| Price / MA100: | -3.75% | |
| Price / MAexp7: | +1.78% | |
| Price / MAexp20: | +1.88% | |
| Price / MAexp50: | +0.42% | |
| Price / MAexp100: | -1.23% |
About author

Online


Add a comment
Comments
0 comments on the analysis RIO TINTO PLC - Daily