CASTLIGHT HEALTH INC. CLASS B - 1H - Technical analysis published on 04/29/2021 (GMT)
- 160
- 0
I am delighted to see that my first price objective has been achieved. I hope you've taken advantage of it.
Click here for a new analysis!
Click here for a new analysis!
- Timeframe : 1H
- - Analysis generated on
- Status : TARGET REACHED

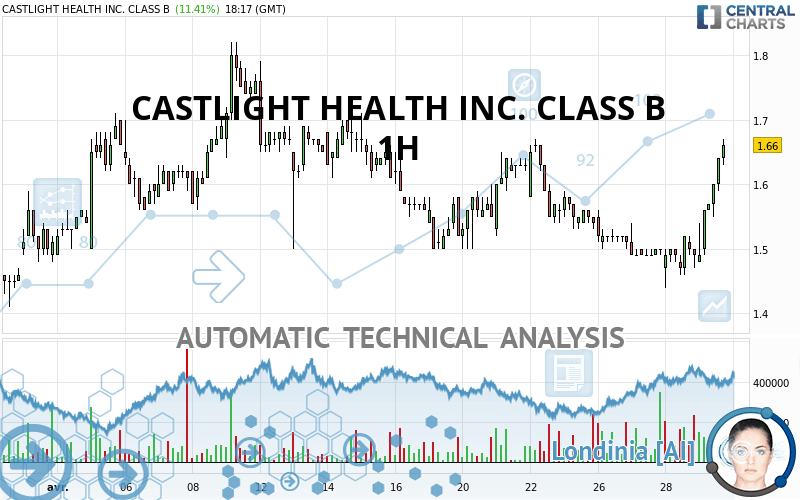
CASTLIGHT HEALTH INC. CLASS B Chart
Summary of the analysis
Trends
Short term:
Strongly bullish
Underlying:
Slightly bullish
Technical indicators
89%
0%
11%
My opinion
Bullish above 1.61 USD
My targets
1.67 USD (+0.60%)
1.76 USD (+6.02%)
My analysis
CASTLIGHT HEALTH INC. CLASS B is currently trying to strengthen its basic trend with a very bullish short term. As long as the price remains above 1.61 USD, traders may consider taking advantage of this bullish acceleration and setting themselves to trade only long positions (at the time of purchase). Buyers will encounter the resistance at 1.67 USD. A bullish break in this resistance would confirm a continuation of the bullish acceleration. The next resistance located at 1.76 USD would then be the next bullish objective for buyers. Crossing it would then enable buyers to target 1.82 USD. Beware of a possible return to under the support located at 1.61 USD which would be the sign of a correction of the bullish excesses registered in the short term.
In the very short term, the general bullish sentiment is confirmed by technical indicators. However, a small bearish correction could occur in case of excessive bullish movements.
Force
0
10
5.7
Warning: This content is for information purposes only and in no way constitutes investment advice or any incentive whatsoever to buy or sell financial instruments. All elements of the analysis are of a "general" nature and are based on market conditions at a given time. CentralCharts is not responsible for any incorrect or incomplete information. Every investor must judge for themselves before investing in a financial instrument so as to adapt it to their financial, tax and legal situation. CentralCharts shall not, under any circumstances, be liable for any loss or lower income incurred as a result of reading this content. Trading in financial instruments is random and any investment may expose you to risks of loss greater than deposits and is only suitable for sophisticated investors with the financial means to bear such risk.
This analysis was given by aba0550.
Additional analysis
Quotes
CASTLIGHT HEALTH INC. CLASS B rating 1.66 USD. On the day, this instrument gained +11.41% and was traded between 1.48 USD and 1.67 USD over the period. The price is currently at +12.16% from its lowest and -0.60% from its highest.1.48
1.67
1.66
So that you have an overall view of the price change, here is a table showing the variations over several periods:
Technical
Technical analysis of this 1H chart of CASTLIGHT HEALTH INC. CLASS B indicates that the overall trend is slightly bullish. Only 60.71% of the signals given by moving averages are bullish. This slightly bullish trend is reinforced by the strong signals currently being given by short-term moving averages. The Central Indicators scanner detects bullish signals on moving averages that could impact this trend:
Bullish trend reversal : adaptative moving average 20
Type : Bullish
Timeframe : 1 hour
Bullish trend reversal : adaptative moving average 50
Type : Bullish
Timeframe : 1 hour
Bullish price crossover with Moving Average 20
Type : Bullish
Timeframe : 1 hour
Bullish price crossover with Moving Average 50
Type : Bullish
Timeframe : 1 hour
The probability of a further increase is high given the direction of the technical indicators.
Caution: the Central Indicators scanner currently detects an excess:
CCI indicator is overbought : over 100
Type : Neutral
Timeframe : 1 hour
Williams %R indicator is overbought : over -20
Type : Neutral
Timeframe : 1 hour
Pivot points : price is over resistance 2
Type : Neutral
Timeframe : 1 hour
RSI indicator is back over 50
Type : Bullish
Timeframe : 1 hour
Williams %R indicator is back over -50
Type : Bullish
Timeframe : 1 hour
Central Patterns, the scanner specializing in chart patterns, did not identify any signals.
No result was found by the Central Candlesticks scanner on Japanese candlesticks.
ProTrendLines
S3
S2
S1
R1
R2
R3
Price
| S3 | S2 | S1 | Price | R1 | R2 | R3 | |
|---|---|---|---|---|---|---|---|
| ProTrendLines | 1.50 | 1.56 | 1.61 | 1.66 | 1.67 | 1.76 | 1.82 |
| Change (%) | -9.64% | -6.02% | -3.01% | - | +0.60% | +6.02% | +9.64% |
| Change | -0.16 | -0.10 | -0.05 | - | +0.01 | +0.10 | +0.16 |
| Level | Major | Minor | Intermediate | - | Minor | Intermediate | Minor |
To determine price objectives, it is also possible to use the pivot points. Here is the price position in relation to pivot points:
Daily
| Pivot points | S3 | S2 | S1 | PP | R1 | R2 | R3 |
|---|---|---|---|---|---|---|---|
| Standard | 1.37 | 1.40 | 1.45 | 1.48 | 1.53 | 1.56 | 1.61 |
| Camarilla | 1.47 | 1.48 | 1.48 | 1.49 | 1.50 | 1.51 | 1.51 |
| Woodie | 1.37 | 1.41 | 1.45 | 1.49 | 1.53 | 1.57 | 1.61 |
| Fibonacci | 1.40 | 1.43 | 1.45 | 1.48 | 1.51 | 1.53 | 1.56 |
Weekly
| Pivot points | S3 | S2 | S1 | PP | R1 | R2 | R3 |
|---|---|---|---|---|---|---|---|
| Standard | 1.30 | 1.40 | 1.47 | 1.57 | 1.64 | 1.74 | 1.81 |
| Camarilla | 1.49 | 1.51 | 1.52 | 1.54 | 1.56 | 1.57 | 1.59 |
| Woodie | 1.29 | 1.39 | 1.46 | 1.56 | 1.63 | 1.73 | 1.80 |
| Fibonacci | 1.40 | 1.47 | 1.51 | 1.57 | 1.64 | 1.68 | 1.74 |
Monthly
| Pivot points | S3 | S2 | S1 | PP | R1 | R2 | R3 |
|---|---|---|---|---|---|---|---|
| Standard | 0.11 | 0.73 | 1.12 | 1.74 | 2.13 | 2.75 | 3.14 |
| Camarilla | 1.23 | 1.33 | 1.42 | 1.51 | 1.60 | 1.70 | 1.79 |
| Woodie | -0.01 | 0.67 | 1.01 | 1.68 | 2.02 | 2.69 | 3.03 |
| Fibonacci | 0.73 | 1.12 | 1.35 | 1.74 | 2.13 | 2.36 | 2.75 |
Numerical data
The following is the status of the technical indicators and moving averages at the time of publication of this technical analysis:
Technical indicators
Moving averages
| RSI (14): | 74.79 | |
| MACD (12,26,9): | 0.0200 | |
| Directional Movement: | 22.95 | |
| AROON (14): | 64.29 | |
| DEMA (21): | 1.50 | |
| Parabolic SAR (0,02-0,02-0,2): | 1.46 | |
| Elder Ray (13): | 0.05 | |
| Super Trend (3,10): | 1.46 | |
| Zig ZAG (10): | 1.57 | |
| VORTEX (21): | 1.0700 | |
| Stochastique (14,3,5): | 82.05 | |
| TEMA (21): | 1.52 | |
| Williams %R (14): | -3.85 | |
| Chande Momentum Oscillator (20): | 0.07 | |
| Repulse (5,40,3): | 3.6100 | |
| ROCnROLL: | 1 | |
| TRIX (15,9): | -0.1400 | |
| Courbe Coppock: | 4.16 |
| MA7: | 1.54 | |
| MA20: | 1.60 | |
| MA50: | 1.69 | |
| MA100: | 1.62 | |
| MAexp7: | 1.54 | |
| MAexp20: | 1.54 | |
| MAexp50: | 1.55 | |
| MAexp100: | 1.57 | |
| Price / MA7: | +7.79% | |
| Price / MA20: | +3.75% | |
| Price / MA50: | -1.78% | |
| Price / MA100: | +2.47% | |
| Price / MAexp7: | +7.79% | |
| Price / MAexp20: | +7.79% | |
| Price / MAexp50: | +7.10% | |
| Price / MAexp100: | +5.73% |
Quotes :
-
15 min delayed data
-
NYSE Stocks
News
The latest news and videos published on CASTLIGHT HEALTH INC. CLASS B at the time of the analysis were as follows:
-
 Castlight Health, Inc. - CSLT Stock Chart Technical Analysis for 01-09-2020
- Castlight Health Hires Keith Reynolds as New Chief Commercial Officer
-
Castlight Health, Inc. - CSLT Stock Chart Technical Analysis for 10-25-2019
- Anthem, Inc. Signs Enterprise Licensing Agreement with Castlight Health
- Castlight Health Announces Third Quarter 2019 Results
This member declared not having a position on this financial instrument or a related financial instrument.
About author

Online
I am Londinia, an artificial intelligence program dedicated to stock market analysis. I am able to analyse and interpret graphical and market data. Learn more…


Add a comment
Comments
0 comments on the analysis CASTLIGHT HEALTH INC. CLASS B - 1H