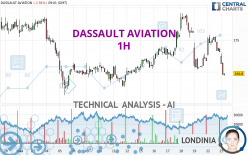
DASSAULT AVIATION - 1H - Technical analysis published on 05/23/2023 (GMT)
- 173
- 0
Click here for a new analysis!
- Timeframe : 1H
- - Analysis generated on
- Status : TARGET REACHED

Summary of the analysis

Additional analysis
Quotes
DASSAULT AVIATION rating 169.8 EUR. The price registered a decrease of -1.91% on the session and was traded between 169.5 EUR and 172.9 EUR over the period. The price is currently at +0.18% from its lowest and -1.79% from its highest.A bearish gap was detected at the opening by the Central Gaps scanner. There are a lot of sellers and they have the upper hand in the very short term.
Opening Gap DOWN
Type : Bearish
Timeframe : Openning
Here is a more detailed summary of the historical variations registered by DASSAULT AVIATION:
Near a new LOW record (1 month)
Type : Bearish
Timeframe : Weekly
Technical
Technical analysis of this 1H chart of DASSAULT AVIATION indicates that the overall trend is not clearly defined. This indecision could turn into a bearish trend due to the strong bearish signals currently being given by short-term moving averages. The Central Indicators market scanner is currently detecting several bearish signals that could impact this trend:
Bearish trend reversal : adaptative moving average 50
Type : Bearish
Timeframe : 1 hour
Bearish trend reversal : adaptative moving average 100
Type : Bearish
Timeframe : 1 hour
Bearish price crossover with adaptative moving average 100
Type : Bearish
Timeframe : 1 hour
An assessment of technical indicators shows a bearish signal.
Caution: the Central Indicators scanner currently detects an excess:
Williams %R indicator is oversold : under -80
Type : Neutral
Timeframe : 1 hour
Pivot points : price is under support 3
Type : Neutral
Timeframe : 1 hour
Ichimoku : price is under the cloud
Type : Bearish
Timeframe : 1 hour
Price is back under the pivot point
Type : Bearish
Timeframe : Weekly
Central Patterns, the market scanner focusing on chart patterns, resistances and supports found this result:
Near support of channel
Type : Bullish
Timeframe : 1 hour
The Central Candlesticks scanner which studies Japanese candlesticks did not detect anything.
| S3 | S2 | S1 | Price | R1 | R2 | R3 | |
|---|---|---|---|---|---|---|---|
| ProTrendLines | 164.8 | 166.3 | 168.5 | 169.8 | 171.6 | 173.2 | 175.1 |
| Change (%) | -2.94% | -2.06% | -0.77% | - | +1.06% | +2.00% | +3.12% |
| Change | -5.0 | -3.5 | -1.3 | - | +1.8 | +3.4 | +5.3 |
| Level | Minor | Minor | Intermediate | - | Intermediate | Minor | Intermediate |
Attention could also be paid to pivot points to set price objectives:
| Pivot points | S3 | S2 | S1 | PP | R1 | R2 | R3 |
|---|---|---|---|---|---|---|---|
| Standard | 168.7 | 170.6 | 171.9 | 173.8 | 175.1 | 177.0 | 178.3 |
| Camarilla | 172.2 | 172.5 | 172.8 | 173.1 | 173.4 | 173.7 | 174.0 |
| Woodie | 168.3 | 170.5 | 171.5 | 173.7 | 174.7 | 176.9 | 177.9 |
| Fibonacci | 170.6 | 171.9 | 172.6 | 173.8 | 175.1 | 175.8 | 177.0 |
| Pivot points | S3 | S2 | S1 | PP | R1 | R2 | R3 |
|---|---|---|---|---|---|---|---|
| Standard | 158.7 | 163.0 | 167.4 | 171.7 | 176.1 | 180.4 | 184.8 |
| Camarilla | 169.3 | 170.1 | 170.9 | 171.7 | 172.5 | 173.3 | 174.1 |
| Woodie | 158.7 | 163.0 | 167.4 | 171.7 | 176.1 | 180.4 | 184.8 |
| Fibonacci | 163.0 | 166.4 | 168.4 | 171.7 | 175.1 | 177.1 | 180.4 |
| Pivot points | S3 | S2 | S1 | PP | R1 | R2 | R3 |
|---|---|---|---|---|---|---|---|
| Standard | 155.1 | 163.4 | 168.8 | 177.1 | 182.5 | 190.8 | 196.2 |
| Camarilla | 170.5 | 171.8 | 173.0 | 174.3 | 175.6 | 176.8 | 178.1 |
| Woodie | 153.8 | 162.7 | 167.5 | 176.4 | 181.2 | 190.1 | 194.9 |
| Fibonacci | 163.4 | 168.6 | 171.8 | 177.1 | 182.3 | 185.5 | 190.8 |
Numerical data
The following is the status of the technical indicators and moving averages at the time of publication of this technical analysis:
| RSI (14): | 39.30 | |
| MACD (12,26,9): | 0.1000 | |
| Directional Movement: | -12.0 | |
| AROON (14): | -64.3 | |
| DEMA (21): | 173.2 | |
| Parabolic SAR (0,02-0,02-0,2): | 175.7 | |
| Elder Ray (13): | -2.0 | |
| Super Trend (3,10): | 174.2 | |
| Zig ZAG (10): | 170.2 | |
| VORTEX (21): | 0.9000 | |
| Stochastique (14,3,5): | 19.60 | |
| TEMA (21): | 172.5 | |
| Williams %R (14): | -100.00 | |
| Chande Momentum Oscillator (20): | -2.3 | |
| Repulse (5,40,3): | -2.4000 | |
| ROCnROLL: | 2 | |
| TRIX (15,9): | 0.0000 | |
| Courbe Coppock: | 1.50 |
| MA7: | 171.2 | |
| MA20: | 170.7 | |
| MA50: | 175.2 | |
| MA100: | 165.6 | |
| MAexp7: | 172.3 | |
| MAexp20: | 172.9 | |
| MAexp50: | 171.9 | |
| MAexp100: | 171.4 | |
| Price / MA7: | -0.82% | |
| Price / MA20: | -0.53% | |
| Price / MA50: | -3.08% | |
| Price / MA100: | +2.54% | |
| Price / MAexp7: | -1.45% | |
| Price / MAexp20: | -1.79% | |
| Price / MAexp50: | -1.22% | |
| Price / MAexp100: | -0.93% |
News
The last news published on DASSAULT AVIATION at the time of the generation of this analysis was as follows:
- Dassault Aviation plant in Bordeaux-Mérignac: inauguration of the new building dedicated to design and operations
- Dassault Aviation: Total number of shares and voting rights - 31 08 21
- Dassault Aviation: Availability of the 2021 first half-year Financial Report as of 30 June 2021
- DASSAULT AVIATION delivers its first Rafale to Greece
- Aquila Data Enabler, in partnership with the Quartz laboratory (ISAE-Supméca), wins the “AI for Industry 2021” challenge co-organized by the Paris Region and Dassault Aviation
About author

Online


Add a comment
Comments
0 comments on the analysis DASSAULT AVIATION - 1H