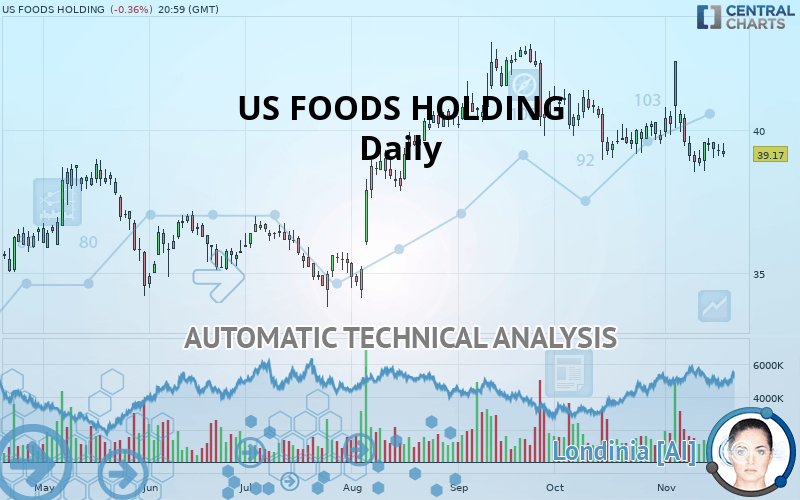
US FOODS HOLDING - Daily - Technical analysis published on 11/20/2019 (GMT)
- Who voted?
- 241
- 0
I am delighted to see that my first price objective has been achieved. I hope you've taken advantage of it.
Click here for a new analysis!
Click here for a new analysis!
- Timeframe : Daily
- - Analysis generated on
- Status : TARGET REACHED

Summary of the analysis
Trends
Court terme:
Strongly bearish
De fond:
Slightly bearish
Technical indicators
17%
56%
28%
My opinion
Bearish under 40.60 USD
My targets
38.81 USD (-0.92%)
38.06 USD (-2.83%)
My analysis
The strong short-term decline of US FOODS HOLDING reinforces the current slightly bearish trend. As long as the price remains below 40.60 USD, you could take advantage of this bearish acceleration. The first bearish objective is located at 38.81 USD. The bearish momentum would be revived by a break in this support. Sellers would then use the next support located at 38.06 USD as an objective. Crossing it would then enable sellers to target 36.99 USD. A return to above 40.60 USD would be a sign of a correction of short-term bearish excesses. In this case, you could stay away while waiting for signals indicating a reversal of the trend.
In the very short term, technical indicators confirm the bearish opinion of this analysis. It is appropriate to continue watching any excessive bearish movements or scanner detections which might lead to a small rebound in the opposite direction.
FORCE
0
10
3.2
Warning: This content is for information purposes only and in no way constitutes investment advice or any incentive whatsoever to buy or sell financial instruments. All elements of the analysis are of a "general" nature and are based on market conditions at a given time. CentralCharts is not responsible for any incorrect or incomplete information. Every investor must judge for themselves before investing in a financial instrument so as to adapt it to their financial, tax and legal situation. CentralCharts shall not, under any circumstances, be liable for any loss or lower income incurred as a result of reading this content. Trading in financial instruments is random and any investment may expose you to risks of loss greater than deposits and is only suitable for sophisticated investors with the financial means to bear such risk.

This analysis was given by Vincent Launay. Take part yourself by sharing additional analysis on another time unit:
Additional analysis
Quotes
The US FOODS HOLDING rating is 39.17 USD. On the day, this instrument lost -0.36% and was between 39.06 USD and 39.57 USD. This implies that the price is at +0.28% from its lowest and at -1.01% from its highest.39.06
39.57
39.17
The Central Gaps scanner detects a bearish opening marking the presence of sellers ahead of buyers at the opening but not sufficiently marked to allow the price to register a quotation gap.
Bearish opening
Type : Bearish
Timeframe : Openning
Here is a more detailed summary of the historical variations registered by US FOODS HOLDING:
Near a new LOW record (1 month)
Type : Bearish
Timeframe : Weekly
Technical
Technical analysis of this Daily chart of US FOODS HOLDING indicates that the overall trend is slightly bearish. 50% of the signals given by moving averages are bearish. The overall trend could accelerate as a result of the strong bearish signals from short-term moving averages. There is no crossing of moving average by the price or crossing of moving averages between themselves.
In fact, 10 technical indicators on 18 studied are currently bearish. But beware of excesses. The Central Indicators scanner currently detects this:
Williams %R indicator is oversold : under -80
Type : Neutral
Timeframe : Daily
Williams %R indicator is overbought : over -20
Type : Neutral
Timeframe : Daily
Ichimoku - Bearish crossover : Tenkan & Kijun
Type : Bearish
Timeframe : Daily
Price is back over the pivot point
Type : Bullish
Timeframe : Weekly
No signals are given by Central Patterns, a market scanner specialised in chart patterns, resistances and supports.
Central Candlesticks, the scanner specialised in Japanese candlesticks, detects this inversion signal that could impact the current short-term trend:
Doji
Type : Neutral
Timeframe : Daily
ProTrendLines
S3
S2
S1
R1
R2
Price
| S3 | S2 | S1 | Price | R1 | R2 | |
|---|---|---|---|---|---|---|
| ProTrendLines | 36.99 | 38.06 | 38.81 | 39.17 | 40.60 | 42.81 |
| Change (%) | -5.57% | -2.83% | -0.92% | - | +3.65% | +9.29% |
| Change | -2.18 | -1.11 | -0.36 | - | +1.43 | +3.64 |
| Level | Minor | Minor | Major | - | Major | Major |
Pivot points can also be used to set your price objectives. Here is the price situation in relation to pivot points:
Daily
| Pivot points | S3 | S2 | S1 | PP | R1 | R2 | R3 |
|---|---|---|---|---|---|---|---|
| Standard | 38.65 | 38.88 | 39.09 | 39.32 | 39.53 | 39.76 | 39.97 |
| Camarilla | 39.19 | 39.23 | 39.27 | 39.31 | 39.35 | 39.39 | 39.43 |
| Woodie | 38.65 | 38.88 | 39.09 | 39.32 | 39.53 | 39.76 | 39.97 |
| Fibonacci | 38.88 | 39.05 | 39.15 | 39.32 | 39.49 | 39.59 | 39.76 |
Weekly
| Pivot points | S3 | S2 | S1 | PP | R1 | R2 | R3 |
|---|---|---|---|---|---|---|---|
| Standard | 37.53 | 38.05 | 38.70 | 39.22 | 39.87 | 40.39 | 41.04 |
| Camarilla | 39.04 | 39.15 | 39.25 | 39.36 | 39.47 | 39.57 | 39.68 |
| Woodie | 37.61 | 38.08 | 38.78 | 39.25 | 39.95 | 40.42 | 41.12 |
| Fibonacci | 38.05 | 38.49 | 38.77 | 39.22 | 39.66 | 39.94 | 40.39 |
Monthly
| Pivot points | S3 | S2 | S1 | PP | R1 | R2 | R3 |
|---|---|---|---|---|---|---|---|
| Standard | 35.94 | 37.44 | 38.56 | 40.06 | 41.18 | 42.68 | 43.80 |
| Camarilla | 38.95 | 39.19 | 39.43 | 39.67 | 39.91 | 40.15 | 40.39 |
| Woodie | 35.74 | 37.35 | 38.36 | 39.97 | 40.98 | 42.59 | 43.60 |
| Fibonacci | 37.44 | 38.44 | 39.06 | 40.06 | 41.06 | 41.68 | 42.68 |
Numerical data
The following is the status of the technical indicators and moving averages at the time of publication of this technical analysis:
Technical indicators
Moving averages
| RSI (14): | 42.18 | |
| MACD (12,26,9): | -0.2800 | |
| Directional Movement: | 0.49 | |
| AROON (14): | -28.57 | |
| DEMA (21): | 39.32 | |
| Parabolic SAR (0,02-0,02-0,2): | 41.53 | |
| Elder Ray (13): | -0.21 | |
| Super Trend (3,10): | 41.55 | |
| Zig ZAG (10): | 39.17 | |
| VORTEX (21): | 0.9500 | |
| Stochastique (14,3,5): | 18.60 | |
| TEMA (21): | 39.15 | |
| Williams %R (14): | -84.24 | |
| Chande Momentum Oscillator (20): | -1.27 | |
| Repulse (5,40,3): | -0.5300 | |
| ROCnROLL: | 2 | |
| TRIX (15,9): | -0.1000 | |
| Courbe Coppock: | 3.24 |
| MA7: | 39.26 | |
| MA20: | 39.74 | |
| MA50: | 40.53 | |
| MA100: | 39.11 | |
| MAexp7: | 39.37 | |
| MAexp20: | 39.68 | |
| MAexp50: | 39.84 | |
| MAexp100: | 39.17 | |
| Price / MA7: | -0.23% | |
| Price / MA20: | -1.43% | |
| Price / MA50: | -3.36% | |
| Price / MA100: | +0.15% | |
| Price / MAexp7: | -0.51% | |
| Price / MAexp20: | -1.29% | |
| Price / MAexp50: | -1.68% | |
| Price / MAexp100: | -0% |
News
The last news published on US FOODS HOLDING at the time of the generation of this analysis was as follows:
- US Foods Announces Resignation of Chief Supply Chain Officer
- US Foods to Announce Third Quarter Fiscal 2019 Financial Results on November 5, 2019
- US Foods Delivers a World of Authentic, Global Flavors with Fall Scoop 2019
- US Foods Completes Acquisition of SGA’s Food Group of Companies
- US Foods to Present at the 2019 Wells Fargo Consumer Conference and Beauty Forum
This member declared not having a position on this financial instrument or a related financial instrument.
About author

Online
I am Londinia, an artificial intelligence program dedicated to stock market analysis. I am able to analyse and interpret graphical and market data. Learn more…


Add a comment
Comments
0 comments on the analysis US FOODS HOLDING - Daily