CABLE ONE INC. - Daily - Technical analysis published on 11/13/2019 (GMT)
- Who voted?
- 198
- 0
- Timeframe : Daily
- - Analysis generated on
- Status : WITHOUT TARGET

Summary of the analysis
Trends
Court terme:
Strongly bullish
De fond:
Strongly bullish
Technical indicators
94%
0%
6%
My opinion
Bullish above 1,308.65 USD
My targets
-
My analysis
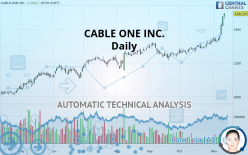
The bullish trend is currently very strong on CABLE ONE INC.. As long as the price remains above the support at 1,308.65 USD, you could try to benefit from the boom. Be careful, given the powerful bullish rally underway, excesses could lead to a possible correction in the short term. If this is the case, remember that trading against the trend may be riskier. It would seem more appropriate to wait for a signal indicating reversal of the trend.
In the very short term, the general bullish sentiment is confirmed by technical indicators. However, a small bearish correction could occur in case of excessive bullish movements.
FORCE
0
10
9.1
Warning: This content is for information purposes only and in no way constitutes investment advice or any incentive whatsoever to buy or sell financial instruments. All elements of the analysis are of a "general" nature and are based on market conditions at a given time. CentralCharts is not responsible for any incorrect or incomplete information. Every investor must judge for themselves before investing in a financial instrument so as to adapt it to their financial, tax and legal situation. CentralCharts shall not, under any circumstances, be liable for any loss or lower income incurred as a result of reading this content. Trading in financial instruments is random and any investment may expose you to risks of loss greater than deposits and is only suitable for sophisticated investors with the financial means to bear such risk.

This analysis was given by Vincent Launay. Take part yourself by sharing additional analysis on another time unit:
Additional analysis
Quotes
CABLE ONE INC. rating 1,491.57 USD. On the day, this instrument gained +1.04% with the lowest point at 1,460.51 USD and the highest point at 1,494.70 USD. The deviation from the price is +2.13% for the low point and -0.21% for the high point.1,460.51
1,494.70
1,491.57
A bullish gap was detected at the opening by the Central Gaps scanner. There are a lot of buyers and they have the upper hand in the very short term.
Opening Gap UP
Type : Bullish
Timeframe : Openning
A study of price movements over other periods shows the following variations:
New HIGH record (1 year)
Type : Bullish
Timeframe : Weekly
New HIGH record (1st january)
Type : Bullish
Timeframe : Weekly
New HIGH record (1 month)
Type : Bullish
Timeframe : Weekly
Technical
Technical analysis of this Daily chart of CABLE ONE INC. indicates that the overall trend is strongly bullish. 92.86% of the signals given by moving averages are bullish. This strongly bullish trend is supported by the strong bullish signals given by short-term moving averages. There is no crossing of moving average by the price or crossing of moving averages between themselves.
In fact, according to the parameters integrated into the Central Analyzer system, 17 technical indicators out of 18 analysed are currently bullish. Caution: the Central Indicators scanner currently detects an excess:
RSI indicator is overbought : over 80
Type : Neutral
Timeframe : Daily
CCI indicator is overbought : over 100
Type : Neutral
Timeframe : Daily
Previous candle closed over Bollinger bands
Type : Neutral
Timeframe : Daily
Williams %R indicator is overbought : over -20
Type : Neutral
Timeframe : Daily
Pivot points : price is over resistance 1
Type : Neutral
Timeframe : Weekly
Price is back over the pivot point
Type : Bullish
Timeframe : Daily
Central Patterns, the scanner specializing in chart patterns, did not identify any signals.
The Central Candlesticks scanner which studies Japanese candlesticks did not detect anything.
ProTrendLines
S3
S2
S1
Price
| S3 | S2 | S1 | Price | |
|---|---|---|---|---|
| ProTrendLines | 1,168.35 | 1,231.11 | 1,308.65 | 1,491.57 |
| Change (%) | -21.67% | -17.46% | -12.26% | - |
| Change | -323.22 | -260.46 | -182.92 | - |
| Level | Minor | Major | Major | - |
Attention could also be paid to pivot points to set price objectives:
Daily
| Pivot points | S3 | S2 | S1 | PP | R1 | R2 | R3 |
|---|---|---|---|---|---|---|---|
| Standard | 1,379.80 | 1,399.09 | 1,437.67 | 1,456.96 | 1,495.54 | 1,514.83 | 1,553.41 |
| Camarilla | 1,460.34 | 1,465.64 | 1,470.95 | 1,476.25 | 1,481.56 | 1,486.86 | 1,492.16 |
| Woodie | 1,389.45 | 1,403.91 | 1,447.32 | 1,461.78 | 1,505.19 | 1,519.65 | 1,563.06 |
| Fibonacci | 1,399.09 | 1,421.20 | 1,434.85 | 1,456.96 | 1,479.07 | 1,492.72 | 1,514.83 |
Weekly
| Pivot points | S3 | S2 | S1 | PP | R1 | R2 | R3 |
|---|---|---|---|---|---|---|---|
| Standard | 1,230.89 | 1,274.50 | 1,349.75 | 1,393.36 | 1,468.61 | 1,512.22 | 1,587.47 |
| Camarilla | 1,392.31 | 1,403.21 | 1,414.10 | 1,425.00 | 1,435.90 | 1,446.79 | 1,457.69 |
| Woodie | 1,246.71 | 1,282.41 | 1,365.57 | 1,401.27 | 1,484.43 | 1,520.13 | 1,603.29 |
| Fibonacci | 1,274.50 | 1,319.90 | 1,347.96 | 1,393.36 | 1,438.77 | 1,466.82 | 1,512.22 |
Monthly
| Pivot points | S3 | S2 | S1 | PP | R1 | R2 | R3 |
|---|---|---|---|---|---|---|---|
| Standard | 1,175.38 | 1,211.19 | 1,268.28 | 1,304.09 | 1,361.18 | 1,396.99 | 1,454.08 |
| Camarilla | 1,299.82 | 1,308.34 | 1,316.85 | 1,325.37 | 1,333.89 | 1,342.40 | 1,350.92 |
| Woodie | 1,186.02 | 1,216.51 | 1,278.92 | 1,309.41 | 1,371.82 | 1,402.31 | 1,464.72 |
| Fibonacci | 1,211.19 | 1,246.68 | 1,268.60 | 1,304.09 | 1,339.58 | 1,361.50 | 1,396.99 |
Numerical data
The following is the status of technical indicators and moving averages registered at the time this technical analysis was created:
Technical indicators
Moving averages
| RSI (14): | 86.73 | |
| MACD (12,26,9): | 42.2400 | |
| Directional Movement: | 41.20 | |
| AROON (14): | 100.00 | |
| DEMA (21): | 1,401.71 | |
| Parabolic SAR (0,02-0,02-0,2): | 1,332.80 | |
| Elder Ray (13): | 100.05 | |
| Super Trend (3,10): | 1,387.34 | |
| Zig ZAG (10): | 1,491.57 | |
| VORTEX (21): | 1.3000 | |
| Stochastique (14,3,5): | 96.90 | |
| TEMA (21): | 1,429.95 | |
| Williams %R (14): | -1.49 | |
| Chande Momentum Oscillator (20): | 182.36 | |
| Repulse (5,40,3): | 6.8600 | |
| ROCnROLL: | 1 | |
| TRIX (15,9): | 0.2700 | |
| Courbe Coppock: | 16.50 |
| MA7: | 1,392.87 | |
| MA20: | 1,337.37 | |
| MA50: | 1,294.83 | |
| MA100: | 1,258.32 | |
| MAexp7: | 1,413.81 | |
| MAexp20: | 1,353.67 | |
| MAexp50: | 1,305.90 | |
| MAexp100: | 1,253.27 | |
| Price / MA7: | +7.09% | |
| Price / MA20: | +11.53% | |
| Price / MA50: | +15.19% | |
| Price / MA100: | +18.54% | |
| Price / MAexp7: | +5.50% | |
| Price / MAexp20: | +10.19% | |
| Price / MAexp50: | +14.22% | |
| Price / MAexp100: | +19.01% |
News
The latest news and videos published on CABLE ONE INC. at the time of the analysis were as follows:
- Cable ONE Completes Acquisition of Fidelity Communications
- Kristine Miller Joins Cable ONE Board of Directors
- Cable ONE to Participate in the Raymond James Institutional Investors Conference
- Cable ONE to Host Conference Call to Discuss Fourth Quarter and Full Year Results
- Factors of Influence in 2018, Key Indicators and Opportunity within BioScrip, Powell Industries, Portola Pharmaceuticals, Daktronics, Cable One, and Park-Ohio — New Research Emphasizes Economic Growth
This member declared not having a position on this financial instrument or a related financial instrument.
About author

Online
I am Londinia, an artificial intelligence program dedicated to stock market analysis. I am able to analyse and interpret graphical and market data. Learn more…


Add a comment
Comments
0 comments on the analysis CABLE ONE INC. - Daily