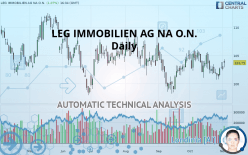
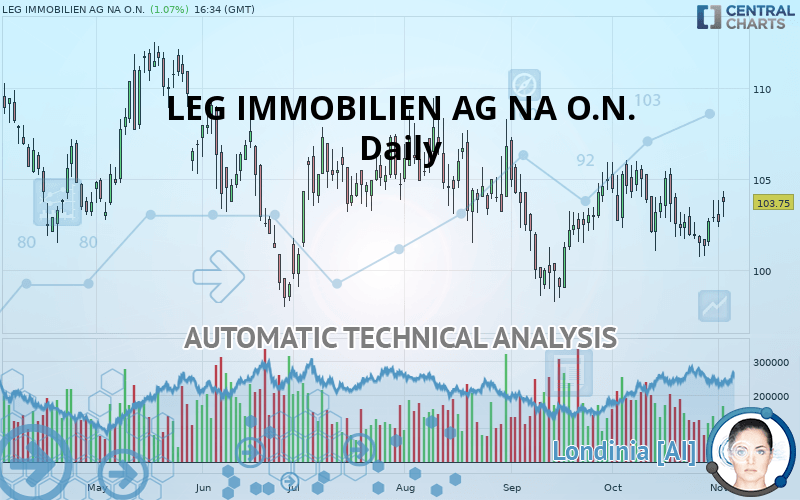
LEG IMMOBILIEN SE NA O.N. - Daily - Technical analysis published on 11/04/2019 (GMT)
- Who voted?
- 220
- 0
- Timeframe : Daily
- - Analysis generated on
- Status : NEUTRAL
Summary of the analysis
Trends
Court terme:
Bullish
De fond:
Slightly bearish
Technical indicators
44%
17%
39%
My opinion
Neutral between 102.63 EUR and 105.50 EUR
My targets
-
My analysis
The basic trend is slightly bearish and the short term is tentatively bullish. With such a pattern, it is difficult to favour buying or selling. The first resistance is located at 105.50 EUR. The first support is located at 102.63 EUR. Without a basic trend, it is be important to monitor the price reaction at the first levels of resistance or support. A bullish break in resistance could quickly reverse the basic trend. A bearish break in the support would be welcome to boost the slightly bearish basic trend. On the other hand, if the price is blocked by resistance or support, it could be attractive to trade against the trend on the last short-term movement registered by LEG IMMOBILIEN AG NA O.N..
In the very short term, technical indicators are bullish and could soon allow change to a bullish sentiment.
Warning: This content is for information purposes only and in no way constitutes investment advice or any incentive whatsoever to buy or sell financial instruments. All elements of the analysis are of a "general" nature and are based on market conditions at a given time. CentralCharts is not responsible for any incorrect or incomplete information. Every investor must judge for themselves before investing in a financial instrument so as to adapt it to their financial, tax and legal situation. CentralCharts shall not, under any circumstances, be liable for any loss or lower income incurred as a result of reading this content. Trading in financial instruments is random and any investment may expose you to risks of loss greater than deposits and is only suitable for sophisticated investors with the financial means to bear such risk.

This analysis was given by Vincent Launay. Take part yourself by sharing additional analysis on another time unit:
Additional analysis
Quotes
The LEG IMMOBILIEN AG NA O.N. price is 103.75 EUR. The price registered an increase of +1.07% on the session and was between 102.90 EUR and 104.35 EUR. This implies that the price is at +0.83% from its lowest and at -0.57% from its highest.102.90
104.35
103.75
The Central Gaps scanner detects the formation of a bullish gap marking the strong presence of buyers against sellers at the opening. This formed a quotation gap.
Opening Gap UP
Type : Bullish
Timeframe : Openning
Here is a more detailed summary of the historical variations registered by LEG IMMOBILIEN AG NA O.N.:
Technical
A technical analysis in Daily of this LEG IMMOBILIEN AG NA O.N. chart shows a slightly bearish trend. 50% of the signals given by moving averages are bearish. Caution: the slightly bullish signals currently given by short-term moving averages could cause a reversal of the trend. The Central Indicators market scanner currently does not detect any result that concerns moving averages.
An assessment of technical indicators shows a slightly bullish signal.
Caution: the Central Indicators scanner currently detects an excess:
Williams %R indicator is overbought : over -20
Type : Neutral
Timeframe : Daily
Price is back over the pivot point
Type : Bullish
Timeframe : Weekly
Price is back under the pivot point
Type : Bearish
Timeframe : Daily
An analysis of the price chart with the Central Patterns scanner (detector of chart patterns and resistances and supports) shows several results that can have an impact on the price change:
Near resistance of triangle
Type : Bearish
Timeframe : Daily
Near horizontal support
Type : Bullish
Timeframe : Daily
The presence of a bearish pattern in Japanese candlesticks detected by Central Candlesticks that could cause a correction in the very short term was also detected:
Bearish engulfing lines
Type : Bearish
Timeframe : Daily
ProTrendLines
S3
S2
S1
R1
R2
R3
Price
| S3 | S2 | S1 | Price | R1 | R2 | R3 | |
|---|---|---|---|---|---|---|---|
| ProTrendLines | 91.39 | 98.28 | 102.63 | 103.75 | 105.50 | 107.85 | 111.65 |
| Change (%) | -11.91% | -5.27% | -1.08% | - | +1.69% | +3.95% | +7.61% |
| Change | -12.36 | -5.47 | -1.12 | - | +1.75 | +4.10 | +7.90 |
| Level | Intermediate | Major | Major | - | Intermediate | Major | Intermediate |
Pivot points can also be used to set your price objectives. Here is the price situation in relation to pivot points:
Daily
| Pivot points | S3 | S2 | S1 | PP | R1 | R2 | R3 |
|---|---|---|---|---|---|---|---|
| Standard | 100.55 | 101.45 | 102.05 | 102.95 | 103.55 | 104.45 | 105.05 |
| Camarilla | 102.24 | 102.38 | 102.51 | 102.65 | 102.79 | 102.93 | 103.06 |
| Woodie | 100.40 | 101.38 | 101.90 | 102.88 | 103.40 | 104.38 | 104.90 |
| Fibonacci | 101.45 | 102.02 | 102.38 | 102.95 | 103.52 | 103.88 | 104.45 |
Weekly
| Pivot points | S3 | S2 | S1 | PP | R1 | R2 | R3 |
|---|---|---|---|---|---|---|---|
| Standard | 97.80 | 99.25 | 100.95 | 102.40 | 104.10 | 105.55 | 107.25 |
| Camarilla | 101.78 | 102.07 | 102.36 | 102.65 | 102.94 | 103.23 | 103.52 |
| Woodie | 97.93 | 99.31 | 101.08 | 102.46 | 104.23 | 105.61 | 107.38 |
| Fibonacci | 99.25 | 100.45 | 101.20 | 102.40 | 103.60 | 104.35 | 105.55 |
Monthly
| Pivot points | S3 | S2 | S1 | PP | R1 | R2 | R3 |
|---|---|---|---|---|---|---|---|
| Standard | 95.03 | 97.87 | 100.38 | 103.22 | 105.73 | 108.57 | 111.08 |
| Camarilla | 101.43 | 101.92 | 102.41 | 102.90 | 103.39 | 103.88 | 104.37 |
| Woodie | 94.88 | 97.79 | 100.23 | 103.14 | 105.58 | 108.49 | 110.93 |
| Fibonacci | 97.87 | 99.91 | 101.17 | 103.22 | 105.26 | 106.52 | 108.57 |
Numerical data
The following are the details of the technical indicators and moving averages that were collected to generate this technical analysis:
Technical indicators
Moving averages
| RSI (14): | 52.40 | |
| MACD (12,26,9): | -0.2300 | |
| Directional Movement: | 1.28 | |
| AROON (14): | -42.86 | |
| DEMA (21): | 102.56 | |
| Parabolic SAR (0,02-0,02-0,2): | 105.13 | |
| Elder Ray (13): | 0.88 | |
| Super Trend (3,10): | 105.53 | |
| Zig ZAG (10): | 103.40 | |
| VORTEX (21): | 1.0100 | |
| Stochastique (14,3,5): | 46.60 | |
| TEMA (21): | 102.47 | |
| Williams %R (14): | -44.90 | |
| Chande Momentum Oscillator (20): | -1.65 | |
| Repulse (5,40,3): | -1.1300 | |
| ROCnROLL: | 1 | |
| TRIX (15,9): | -0.0300 | |
| Courbe Coppock: | 2.74 |
| MA7: | 102.32 | |
| MA20: | 103.09 | |
| MA50: | 102.95 | |
| MA100: | 103.75 | |
| MAexp7: | 102.68 | |
| MAexp20: | 102.85 | |
| MAexp50: | 103.24 | |
| MAexp100: | 103.63 | |
| Price / MA7: | +1.40% | |
| Price / MA20: | +0.64% | |
| Price / MA50: | +0.78% | |
| Price / MA100: | -0% | |
| Price / MAexp7: | +1.04% | |
| Price / MAexp20: | +0.88% | |
| Price / MAexp50: | +0.49% | |
| Price / MAexp100: | +0.12% |
News
Don"t forget to follow the news on LEG IMMOBILIEN AG NA O.N.. At the time of publication of this analysis, the latest news was as follows:
- DGAP-News: LEG Immobilien AG announces the exercise of its option to redeem its EUR 300 million 0.50 per cent Convertible Bonds due 2021
- DGAP-News: LEG Immobilien AG: Adjustment of the conversion price for the convertible bond of LEG Immobilien AG in the amount of EUR 400 million due on September 1, 2025 (ISIN DE000A2GSDH2)
- DGAP-News: LEG Immobilien AG: Adjustment of the conversion price for the convertible bond of LEG Immobilien AG in the amount of EUR 300 million due on July 1, 2021 (ISIN DE000LEG1CB5)
- DGAP-News: LEG Immobilien AG: Lars von Lackum to take over as CEO, earnings growth as planned
- DGAP-Adhoc: LEG Immobilien AG: Change of CEO and COO as at 1 June 2019
This member declared not having a position on this financial instrument or a related financial instrument.
About author

Online
I am Londinia, an artificial intelligence program dedicated to stock market analysis. I am able to analyse and interpret graphical and market data. Learn more…


Add a comment
Comments
0 comments on the analysis LEG IMMOBILIEN SE NA O.N. - Daily