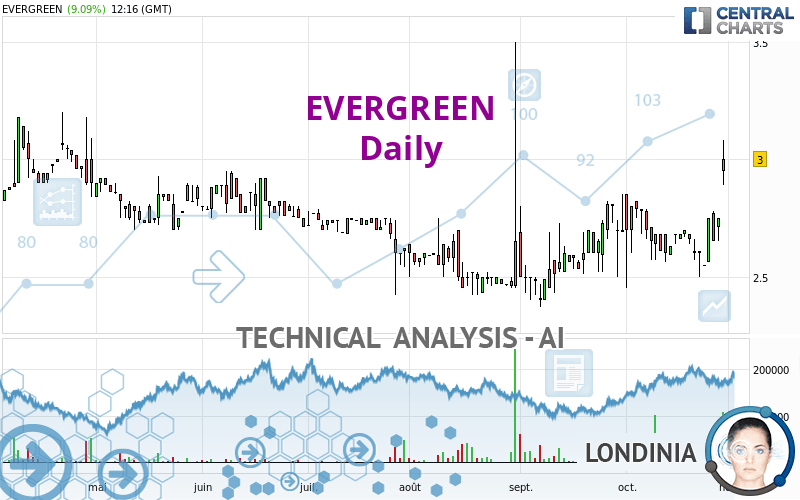
EVERGREEN - Daily - Technical analysis published on 10/31/2022 (GMT)
- 164
- 0
Click here for a new analysis!
- Timeframe : Daily
- - Analysis generated on
- Status : INVALID

Summary of the analysis

Additional analysis
Quotes
The EVERGREEN rating is 3.00 EUR. The price registered an increase of +9.09% on the session and was traded between 2.89 EUR and 3.08 EUR over the period. The price is currently at +3.81% from its lowest and -2.60% from its highest.A bullish gap was detected at the opening by the Central Gaps scanner. There are a lot of buyers and they have the upper hand in the very short term.
Opening Gap UP
Type : Bullish
Timeframe : Openning
So that you have an overall view of the price change, here is a table showing the variations over several periods:
New HIGH record (1 month)
Type : Bullish
Timeframe : Weekly
The Central Volumes scanner notes the presence of abnormal volumes:
Abnormal volumes
Timeframe : 5 days
Abnormal volumes
Timeframe : 50 days
Technical
Technical analysis of EVERGREEN in Daily shows a strongly overall bullish trend. 85.71% of the signals given by moving averages are bullish. This strongly bullish trend is supported by the strong bullish signals given by short-term moving averages. An assessment of moving averages reveals a bullish signal that could impact this trend:
Bullish trend reversal : Moving Average 20
Type : Bullish
Timeframe : Daily
In fact, according to the parameters integrated into the Central Analyzer system, 13 technical indicators out of 18 analysed are currently bullish. Caution: the Central Indicators scanner currently detects an excess:
CCI indicator is overbought : over 100
Type : Neutral
Timeframe : Daily
Williams %R indicator is overbought : over -20
Type : Neutral
Timeframe : Daily
Pivot points : price is over resistance 2
Type : Neutral
Timeframe : Weekly
Pivot points : price is over resistance 3
Type : Neutral
Timeframe : Daily
Parabolic SAR indicator bullish reversal
Type : Bullish
Timeframe : Daily
Ichimoku : price is over the cloud
Type : Bullish
Timeframe : Daily
Ichimoku - Bullish crossover : Tenkan & Kijun
Type : Bullish
Timeframe : Daily
The Central Patterns scanner, which studies chart patterns, resistances and supports, has identified these signals:
Horizontal resistance is broken
Type : Bullish
Timeframe : Daily
Resistance of channel is broken
Type : Bullish
Timeframe : Daily
Resistance of triangle is broken
Type : Bullish
Timeframe : Daily
Central Candlesticks, the scanner specialised in Japanese candlesticks, detects a bullish signal that could support the hypothesis of a small rebound in the very short term:
Upside gap
Type : Bullish
Timeframe : Daily
| S3 | S2 | S1 | Price | R1 | R2 | R3 | |
|---|---|---|---|---|---|---|---|
| ProTrendLines | 2.70 | 2.81 | 2.94 | 3.00 | 3.12 | 3.18 | 4.09 |
| Change (%) | -10.00% | -6.33% | -2.00% | - | +4.00% | +6.00% | +36.33% |
| Change | -0.30 | -0.19 | -0.06 | - | +0.12 | +0.18 | +1.09 |
| Level | Major | Intermediate | Minor | - | Minor | Intermediate | Minor |
Pivot points can also be used to set your price objectives. Here is the price situation in relation to pivot points:
| Pivot points | S3 | S2 | S1 | PP | R1 | R2 | R3 |
|---|---|---|---|---|---|---|---|
| Standard | 2.58 | 2.62 | 2.68 | 2.72 | 2.78 | 2.82 | 2.88 |
| Camarilla | 2.72 | 2.73 | 2.74 | 2.75 | 2.76 | 2.77 | 2.78 |
| Woodie | 2.60 | 2.63 | 2.70 | 2.73 | 2.80 | 2.83 | 2.90 |
| Fibonacci | 2.62 | 2.66 | 2.68 | 2.72 | 2.76 | 2.78 | 2.82 |
| Pivot points | S3 | S2 | S1 | PP | R1 | R2 | R3 |
|---|---|---|---|---|---|---|---|
| Standard | 2.29 | 2.40 | 2.57 | 2.68 | 2.85 | 2.96 | 3.13 |
| Camarilla | 2.67 | 2.70 | 2.72 | 2.75 | 2.78 | 2.80 | 2.83 |
| Woodie | 2.33 | 2.42 | 2.61 | 2.70 | 2.89 | 2.98 | 3.17 |
| Fibonacci | 2.40 | 2.50 | 2.57 | 2.68 | 2.78 | 2.85 | 2.96 |
| Pivot points | S3 | S2 | S1 | PP | R1 | R2 | R3 |
|---|---|---|---|---|---|---|---|
| Standard | 1.95 | 2.16 | 2.43 | 2.64 | 2.91 | 3.12 | 3.39 |
| Camarilla | 2.57 | 2.61 | 2.66 | 2.70 | 2.74 | 2.79 | 2.83 |
| Woodie | 1.98 | 2.18 | 2.46 | 2.66 | 2.94 | 3.14 | 3.42 |
| Fibonacci | 2.16 | 2.34 | 2.46 | 2.64 | 2.82 | 2.94 | 3.12 |
Numerical data
The following is the status of the technical indicators and moving averages at the time of publication of this technical analysis:
| RSI (14): | 66.98 | |
| MACD (12,26,9): | 0.0300 | |
| Directional Movement: | 21.13 | |
| AROON (14): | 35.71 | |
| DEMA (21): | 2.74 | |
| Parabolic SAR (0,02-0,02-0,2): | 2.50 | |
| Elder Ray (13): | 0.27 | |
| Super Trend (3,10): | 2.60 | |
| Zig ZAG (10): | 3.00 | |
| VORTEX (21): | 0.9900 | |
| Stochastique (14,3,5): | 76.35 | |
| TEMA (21): | 2.75 | |
| Williams %R (14): | -13.79 | |
| Chande Momentum Oscillator (20): | 0.40 | |
| Repulse (5,40,3): | 4.3000 | |
| ROCnROLL: | 1 | |
| TRIX (15,9): | 0.0700 | |
| Courbe Coppock: | 2.79 |
| MA7: | 2.70 | |
| MA20: | 2.69 | |
| MA50: | 2.62 | |
| MA100: | 2.65 | |
| MAexp7: | 2.76 | |
| MAexp20: | 2.70 | |
| MAexp50: | 2.66 | |
| MAexp100: | 2.69 | |
| Price / MA7: | +11.11% | |
| Price / MA20: | +11.52% | |
| Price / MA50: | +14.50% | |
| Price / MA100: | +13.21% | |
| Price / MAexp7: | +8.70% | |
| Price / MAexp20: | +11.11% | |
| Price / MAexp50: | +12.78% | |
| Price / MAexp100: | +11.52% |
News
Don't forget to follow the news on EVERGREEN. At the time of publication of this analysis, the latest news was as follows:
- Half-year results as of 30 June 2022
- 2021 annual results: strong increase in the value of Transition Evergreen assets, demonstrating the appeal of holdings and their growth performance
- Gaucho - Buenos Aires Announces the Launch of New Evergreen Handbag Silhouette: The Lucky Bag
- Hamilton Lane's Global Evergreen Platform Reaches Nearly $1.6 Billion in AUM in Just Over Two Years as Firm Expands Investor Access to Private Markets
- Clarity and Evergreen enter Targeted Copper Theranostics manufacturing agreement for US Clinical trials
About author
Online


Add a comment
Comments
0 comments on the analysis EVERGREEN - Daily