FINSBURY GROWTH & INCOME TRUST ORD 25P - Daily - Technical analysis published on 12/04/2019 (GMT)
- Who voted?
- 267
- 0
Click here for a new analysis!
- Timeframe : Daily
- - Analysis generated on
- Status : INVALID
Summary of the analysis

Additional analysis
Quotes
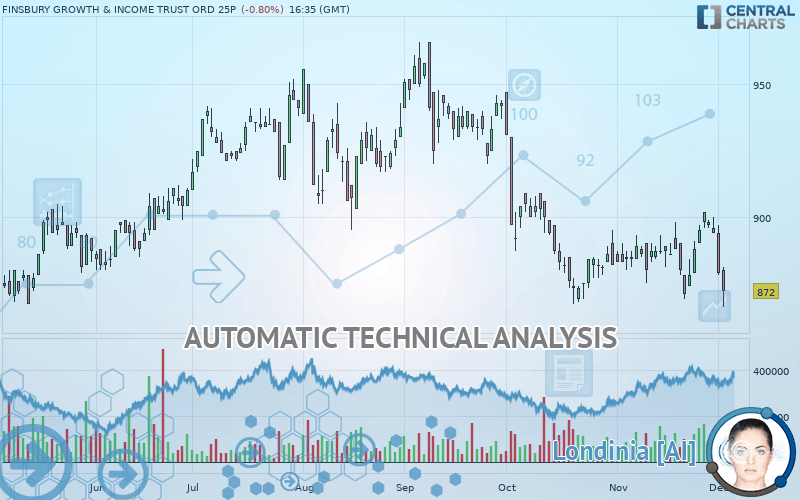
The FINSBURY GROWTH & INCOME TRUST ORD 25P price is 872 GBX. The price is lower by -0.80% since the last closing with the lowest point at 866 GBX and the highest point at 881 GBX. The deviation from the price is +0.69% for the low point and -1.02% for the high point.The Central Gaps scanner detects a bullish opening. A small advantage for buyers in the very short term.
Bullish opening
Type : Bullish
Timeframe : Openning
Here is a more detailed summary of the historical variations registered by FINSBURY GROWTH & INCOME TRUST ORD 25P:
Near a new HIGH record (1 month)
Type : Bullish
Timeframe : Weekly
Technical
Technical analysis of this Daily chart of FINSBURY GROWTH & INCOME TRUST ORD 25P indicates that the overall trend is strongly bearish. The signals given by moving averages are 92.86% bearish. This strong bearish trend is confirmed by the strong signals currently being given by short-term moving averages. The Central Indicators scanner detects bearish signals on moving averages that could impact this trend:
Bearish trend reversal : Moving Average 20
Type : Bearish
Timeframe : Daily
Bearish trend reversal : adaptative moving average 20
Type : Bearish
Timeframe : Daily
Bearish trend reversal : adaptative moving average 50
Type : Bearish
Timeframe : Daily
Bearish trend reversal : adaptative moving average 100
Type : Bearish
Timeframe : Daily
Bearish price crossover with Moving Average 20
Type : Bearish
Timeframe : Daily
Bearish price crossover with Moving Average 50
Type : Bearish
Timeframe : Daily
Bearish price crossover with adaptative moving average 20
Type : Bearish
Timeframe : Daily
The probability of a further decline is low given the direction of the technical indicators.
Central Indicators, the detector scanner for these technical indicators has recently detected several signals:
Pivot points : price is under support 1
Type : Neutral
Timeframe : Daily
Pivot points : price is under support 1
Type : Neutral
Timeframe : Weekly
RSI indicator is back under 50
Type : Bearish
Timeframe : Daily
Ichimoku : price is under the cloud
Type : Bearish
Timeframe : Daily
MACD indicator is back under 0
Type : Bearish
Timeframe : Daily
Price is back over the pivot point
Type : Bullish
Timeframe : Weekly
Momentum indicator is back under 0
Type : Bearish
Timeframe : Daily
Williams %R indicator is back under -50
Type : Bearish
Timeframe : Daily
Central Patterns, the market scanner focusing on chart patterns, resistances and supports found this result:
Support of triangle is broken
Type : Bearish
Timeframe : Daily
The Central Candlesticks scanner, specialised in Japanese candlesticks, did not identify any signals.
| S3 | S2 | S1 | Price | R1 | R2 | R3 | |
|---|---|---|---|---|---|---|---|
| ProTrendLines | 823 | 854 | 871 | 872 | 889 | 906 | 939 |
| Change (%) | -5.62% | -2.06% | -0.11% | - | +1.95% | +3.90% | +7.68% |
| Change | -49 | -18 | -1 | - | +17 | +34 | +67 |
| Level | Minor | Major | Major | - | Minor | Intermediate | Minor |
Attention could also be paid to pivot points to set price objectives:
| Pivot points | S3 | S2 | S1 | PP | R1 | R2 | R3 |
|---|---|---|---|---|---|---|---|
| Standard | 853 | 866 | 872 | 885 | 891 | 904 | 910 |
| Camarilla | 874 | 876 | 877 | 879 | 881 | 883 | 884 |
| Woodie | 851 | 864 | 870 | 883 | 889 | 902 | 908 |
| Fibonacci | 866 | 873 | 877 | 885 | 892 | 896 | 904 |
| Pivot points | S3 | S2 | S1 | PP | R1 | R2 | R3 |
|---|---|---|---|---|---|---|---|
| Standard | 858 | 869 | 881 | 892 | 904 | 915 | 927 |
| Camarilla | 888 | 890 | 892 | 894 | 896 | 898 | 900 |
| Woodie | 860 | 869 | 883 | 892 | 906 | 915 | 929 |
| Fibonacci | 869 | 878 | 883 | 892 | 901 | 906 | 915 |
| Pivot points | S3 | S2 | S1 | PP | R1 | R2 | R3 |
|---|---|---|---|---|---|---|---|
| Standard | 842 | 855 | 875 | 888 | 908 | 921 | 941 |
| Camarilla | 885 | 888 | 891 | 894 | 897 | 900 | 903 |
| Woodie | 845 | 857 | 878 | 890 | 911 | 923 | 944 |
| Fibonacci | 855 | 868 | 876 | 888 | 901 | 909 | 921 |
Numerical data
The following is the status of technical indicators and moving averages registered at the time this technical analysis was created:
| RSI (14): | 39.00 | |
| MACD (12,26,9): | -1.0000 | |
| Directional Movement: | -15 | |
| AROON (14): | -29 | |
| DEMA (21): | 884 | |
| Parabolic SAR (0,02-0,02-0,2): | 902 | |
| Elder Ray (13): | -13 | |
| Super Trend (3,10): | 871 | |
| Zig ZAG (10): | 872 | |
| VORTEX (21): | 1.0000 | |
| Stochastique (14,3,5): | 41.00 | |
| TEMA (21): | 886 | |
| Williams %R (14): | -83.00 | |
| Chande Momentum Oscillator (20): | -15 | |
| Repulse (5,40,3): | -3.0000 | |
| ROCnROLL: | 2 | |
| TRIX (15,9): | 0.0000 | |
| Courbe Coppock: | 0.00 |
| MA7: | 890 | |
| MA20: | 886 | |
| MA50: | 891 | |
| MA100: | 907 | |
| MAexp7: | 885 | |
| MAexp20: | 886 | |
| MAexp50: | 892 | |
| MAexp100: | 893 | |
| Price / MA7: | -2.02% | |
| Price / MA20: | -1.58% | |
| Price / MA50: | -2.13% | |
| Price / MA100: | -3.86% | |
| Price / MAexp7: | -1.47% | |
| Price / MAexp20: | -1.58% | |
| Price / MAexp50: | -2.24% | |
| Price / MAexp100: | -2.35% |
News
Don"t forget to follow the news on FINSBURY GROWTH & INCOME TRUST ORD 25P. At the time of publication of this analysis, the latest news was as follows:
- Finsbury Growth & Income Trust Plc - Compliance with Market Abuse Regulation
- Finsbury Growth & Income Trust Plc - Monthly Fact Sheet as at 31 October 2019
- Finsbury Growth & Income Trust Plc - Block Listing Application
- Finsbury Growth & Income Trust Plc - Director/PDMR Shareholding
- Finsbury Growth & Income Trust Plc - Monthly Fact Sheet as at 30 September 2019
About author

Online


Add a comment
Comments
0 comments on the analysis FINSBURY GROWTH & INCOME TRUST ORD 25P - Daily