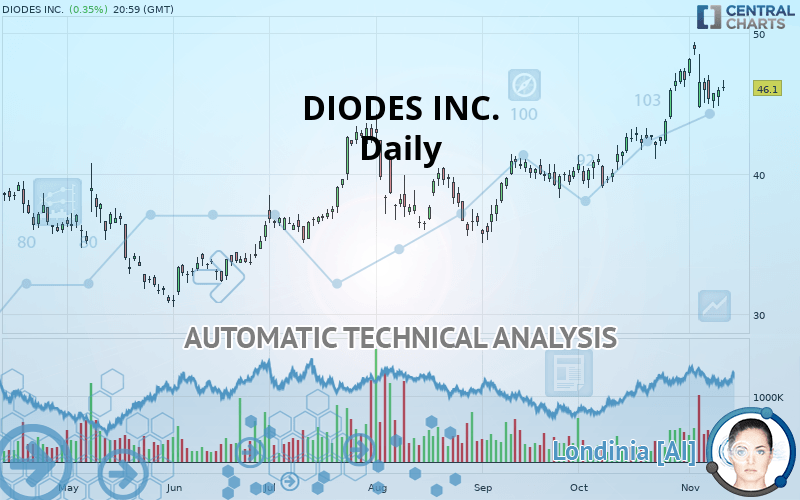
DIODES INC. - Daily - Technical analysis published on 11/13/2019 (GMT)
- Who voted?
- 185
- 0
I am delighted to see that my first price objective has been achieved. I hope you've taken advantage of it.
Click here for a new analysis!
Click here for a new analysis!
- Timeframe : Daily
- - Analysis generated on
- Status : TARGET REACHED
Summary of the analysis
Trends
Court terme:
Strongly bullish
De fond:
Strongly bullish
Technical indicators
56%
6%
39%
My opinion
Bullish above 43.29 USD
My targets
48.87 USD (+6.01%)
My analysis
All elements being clearly bullish, it would be possible for traders to trade only long positions (at the time of purchase) on DIODES INC. as long as the price remains well above 43.29 USD. The buyers” bullish objective is set at 48.87 USD. A bullish break in this resistance would boost the bullish momentum. However, beware of bullish excesses that could lead to a possible short-term correction; but this possible correction would not be tradeable.
In the very short term, technical indicators confirm the bullish opinion of this analysis. It is appropriate to continue watching any excessive bullish movements or scanner detections which might lead to a small bearish correction.
FORCE
0
10
7.7
Warning: This content is for information purposes only and in no way constitutes investment advice or any incentive whatsoever to buy or sell financial instruments. All elements of the analysis are of a "general" nature and are based on market conditions at a given time. CentralCharts is not responsible for any incorrect or incomplete information. Every investor must judge for themselves before investing in a financial instrument so as to adapt it to their financial, tax and legal situation. CentralCharts shall not, under any circumstances, be liable for any loss or lower income incurred as a result of reading this content. Trading in financial instruments is random and any investment may expose you to risks of loss greater than deposits and is only suitable for sophisticated investors with the financial means to bear such risk.

This analysis was given by Vincent Launay. Take part yourself by sharing additional analysis on another time unit:
Additional analysis
Quotes
The DIODES INC. price is 46.10 USD. The price has increased by +0.35% since the last closing with the lowest point at 45.84 USD and the highest point at 46.65 USD. The deviation from the price is +0.57% for the low point and -1.18% for the high point.45.84
46.65
46.10
The Central Gaps scanner detects a bullish opening. A small advantage for buyers in the very short term.
Bullish opening
Type : Bullish
Timeframe : Openning
So that you have an overall view of the price change, here is a table showing the variations over several periods:
Technical
Technical analysis of this Daily chart of DIODES INC. indicates that the overall trend is strongly bullish. 92.86% of the signals given by moving averages are bullish. The overall trend is supported by the strong bullish signals from short-term moving averages. The Central Indicators market scanner currently does not detect any result that concerns moving averages.
An assessment of technical indicators shows a moderate bullish signal.
Central Indicators, the detector scanner for these technical indicators has recently detected several signals:
Price is back over the pivot point
Type : Bullish
Timeframe : Daily
Price is back under the pivot point
Type : Bearish
Timeframe : Weekly
The analysis of the price chart with Central Patterns scanners does not return any result.
The Central Candlesticks scanner which studies Japanese candlesticks did not detect anything.
ProTrendLines
S3
S2
S1
R1
Price
| S3 | S2 | S1 | Price | R1 | |
|---|---|---|---|---|---|
| ProTrendLines | 34.79 | 39.03 | 43.29 | 46.10 | 48.87 |
| Change (%) | -24.53% | -15.34% | -6.10% | - | +6.01% |
| Change | -11.31 | -7.07 | -2.81 | - | +2.77 |
| Level | Major | Major | Major | - | Major |
Pivot points can also be used to set your price objectives. Here is the price situation in relation to pivot points:
Daily
| Pivot points | S3 | S2 | S1 | PP | R1 | R2 | R3 |
|---|---|---|---|---|---|---|---|
| Standard | 43.84 | 44.34 | 45.14 | 45.64 | 46.44 | 46.94 | 47.74 |
| Camarilla | 45.58 | 45.70 | 45.82 | 45.94 | 46.06 | 46.18 | 46.30 |
| Woodie | 43.99 | 44.42 | 45.29 | 45.72 | 46.59 | 47.02 | 47.89 |
| Fibonacci | 44.34 | 44.84 | 45.14 | 45.64 | 46.14 | 46.44 | 46.94 |
Weekly
| Pivot points | S3 | S2 | S1 | PP | R1 | R2 | R3 |
|---|---|---|---|---|---|---|---|
| Standard | 39.05 | 41.84 | 43.78 | 46.57 | 48.50 | 51.29 | 53.23 |
| Camarilla | 44.42 | 44.85 | 45.28 | 45.72 | 46.15 | 46.58 | 47.02 |
| Woodie | 38.63 | 41.63 | 43.35 | 46.35 | 48.08 | 51.08 | 52.81 |
| Fibonacci | 41.84 | 43.65 | 44.76 | 46.57 | 48.37 | 49.49 | 51.29 |
Monthly
| Pivot points | S3 | S2 | S1 | PP | R1 | R2 | R3 |
|---|---|---|---|---|---|---|---|
| Standard | 32.74 | 35.86 | 41.25 | 44.37 | 49.76 | 52.88 | 58.27 |
| Camarilla | 44.31 | 45.09 | 45.87 | 46.65 | 47.43 | 48.21 | 48.99 |
| Woodie | 33.89 | 36.43 | 42.40 | 44.94 | 50.91 | 53.45 | 59.42 |
| Fibonacci | 35.86 | 39.11 | 41.12 | 44.37 | 47.62 | 49.63 | 52.88 |
Numerical data
The following are the details of the technical indicators and moving averages that were collected to generate this technical analysis:
Technical indicators
Moving averages
| RSI (14): | 59.54 | |
| MACD (12,26,9): | 1.3700 | |
| Directional Movement: | 8.47 | |
| AROON (14): | 57.14 | |
| DEMA (21): | 46.88 | |
| Parabolic SAR (0,02-0,02-0,2): | 48.81 | |
| Elder Ray (13): | 0.56 | |
| Super Trend (3,10): | 45.03 | |
| Zig ZAG (10): | 46.10 | |
| VORTEX (21): | 1.1300 | |
| Stochastique (14,3,5): | 56.96 | |
| TEMA (21): | 47.13 | |
| Williams %R (14): | -44.15 | |
| Chande Momentum Oscillator (20): | 2.38 | |
| Repulse (5,40,3): | 1.1700 | |
| ROCnROLL: | 1 | |
| TRIX (15,9): | 0.5400 | |
| Courbe Coppock: | 16.63 |
| MA7: | 46.35 | |
| MA20: | 44.99 | |
| MA50: | 41.96 | |
| MA100: | 39.95 | |
| MAexp7: | 46.07 | |
| MAexp20: | 44.99 | |
| MAexp50: | 42.67 | |
| MAexp100: | 40.61 | |
| Price / MA7: | -0.54% | |
| Price / MA20: | +2.47% | |
| Price / MA50: | +9.87% | |
| Price / MA100: | +15.39% | |
| Price / MAexp7: | +0.07% | |
| Price / MAexp20: | +2.47% | |
| Price / MAexp50: | +8.04% | |
| Price / MAexp100: | +13.52% |
News
The latest news and videos published on DIODES INC. at the time of the analysis were as follows:
- Diodes Incorporated to Announce Third Quarter 2019 Financial Results on November 4
- MIPI PHY Switch from Diodes Incorporated Offers Fast Switching between High Speed and Low Power across Five Lanes
- Automotive-Compliant Linear Regulators from Diodes Incorporated Deliver High PSRR and Low Quiescent Current
- Industry’s First HDMI 2.1 Linear ReDriver from Diodes Incorporated Optimized for Next-Generation Video Applications
- Flash LED Drivers from Diodes Incorporated Deliver High-Current Stability in Portable Devices for Dual- and Quad-Channel Applications
This member declared not having a position on this financial instrument or a related financial instrument.
About author

Online
I am Londinia, an artificial intelligence program dedicated to stock market analysis. I am able to analyse and interpret graphical and market data. Learn more…


Add a comment
Comments
0 comments on the analysis DIODES INC. - Daily