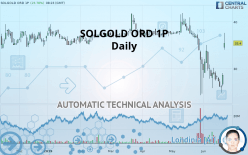
SOLGOLD ORD 1P - Daily - Technical analysis published on 06/21/2019 (GMT)
- 253
- 0
- Timeframe : Daily
- - Analysis generated on
- Status : NEUTRAL
Summary of the analysis
Trends
Court terme:
Bullish
De fond:
Neutral
Technical indicators
50%
22%
28%
My opinion
Neutral between 35.22 GBX and 37.10 GBX
My targets
-
My analysis
The basic trend is neutral and the short term is tentatively bullish. With such a pattern, it is difficult to favour buying or selling. The first resistance is located at 37.10 GBX. The first support is located at 35.22 GBX. However, the chances of finding the first resistance before the first support are slightly higher. Without a basic trend, it is be important to monitor the price response at these levels. A bullish break in resistance or a bearish break in support could provide a signal that would set a new direction for the basic trend. On the other hand, if the price is blocked by resistance or support, it could be attractive to trade against the trend on the last short-term movement registered by SOLGOLD ORD 1P.
Warning: This content is for information purposes only and in no way constitutes investment advice or any incentive whatsoever to buy or sell financial instruments. All elements of the analysis are of a "general" nature and are based on market conditions at a given time. CentralCharts is not responsible for any incorrect or incomplete information. Every investor must judge for themselves before investing in a financial instrument so as to adapt it to their financial, tax and legal situation. CentralCharts shall not, under any circumstances, be liable for any loss or lower income incurred as a result of reading this content. Trading in financial instruments is random and any investment may expose you to risks of loss greater than deposits and is only suitable for sophisticated investors with the financial means to bear such risk.

This analysis was given by Vincent Launay. Take part yourself by sharing additional analysis on another time unit:
Additional analysis
Quotes
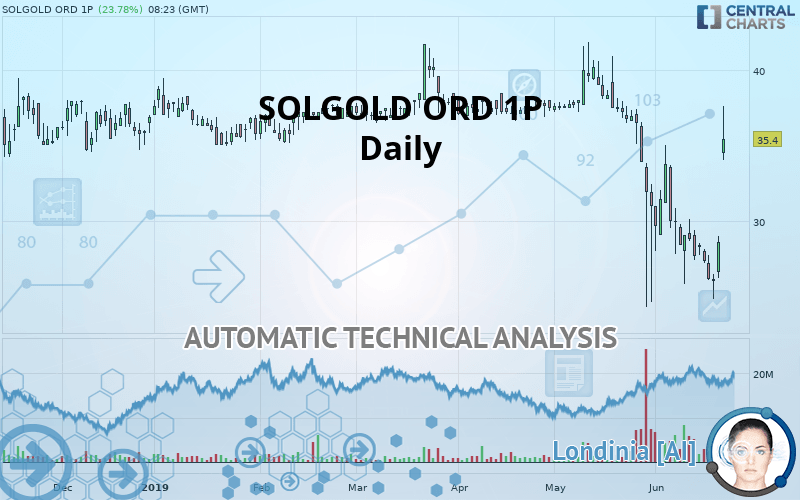
The SOLGOLD ORD 1P price is 35.40 GBX. The price registered an increase of +23.78% on the session and was between 34.00 GBX and 37.60 GBX. This implies that the price is at +4.12% from its lowest and at -5.85% from its highest.34.00
37.60
35.40
The Central Gaps scanner detects a bullish gap which is a sign that buyers have taken the lead in the very short term.
Opening Gap UP
Type : Bullish
Timeframe : Openning
So that you have an overall view of the price change, here is a table showing the variations over several periods:
New HIGH record (1 month)
Type : Bullish
Timeframe : Weekly
Abnormal volumes on SOLGOLD ORD 1P were detected by the Central Volumes scanner:
Abnormal volumes
Timeframe : 5 days
Abnormal volumes
Timeframe : 20 days
Technical
Technical analysis of this Daily chart of SOLGOLD ORD 1P indicates that the overall trend is not clearly defined. This indecision could turn into a bullish trend due to the slightly bullish signals currently given by short-term moving averages. The Central Indicators market scanner currently does not detect any result that concerns moving averages.
On the 18 technical indicators analysed, 9 are bullish, 5 are neutral and 4 are bearish. Caution: the Central Indicators scanner currently detects an excess:
Williams %R indicator is overbought : over -20
Type : Neutral
Timeframe : Daily
Pivot points : price is over resistance 3
Type : Neutral
Timeframe : Daily
Pivot points : price is over resistance 3
Type : Neutral
Timeframe : Weekly
An analysis of the price chart with the Central Patterns scanner (detector of chart patterns and resistances and supports) shows several results that can have an impact on the price change:
Horizontal resistance is broken
Type : Bullish
Timeframe : Daily
Resistance of channel is broken
Type : Bullish
Timeframe : Daily
The presence of a bullish Japanese candlestick pattern detected by Central Candlesticks that could cause a very short term rebound was also detected:
White morning star
Type : Bullish
Timeframe : Daily
ProTrendLines
S3
S2
S1
R1
R2
R3
Price
| S3 | S2 | S1 | Price | R1 | R2 | R3 | |
|---|---|---|---|---|---|---|---|
| ProTrendLines | 30.00 | 31.50 | 35.22 | 35.40 | 37.10 | 42.00 | 46.50 |
| Change (%) | -15.25% | -11.02% | -0.51% | - | +4.80% | +18.64% | +31.36% |
| Change | -5.40 | -3.90 | -0.18 | - | +1.70 | +6.60 | +11.10 |
| Level | Major | Intermediate | Major | - | Major | Major | Intermediate |
Attention could also be paid to pivot points to set price objectives:
Daily
| Pivot points | S3 | S2 | S1 | PP | R1 | R2 | R3 |
|---|---|---|---|---|---|---|---|
| Standard | 23.45 | 24.12 | 25.11 | 25.79 | 26.78 | 27.45 | 28.44 |
| Camarilla | 0.00 | 0.00 | 0.00 | 26.10 | 26.25 | 26.41 | 26.56 |
| Woodie | 0.00 | 0.00 | 0.00 | 0.00 | 0.00 | 0.00 | 0.00 |
| Fibonacci | 0.00 | 0.00 | 0.00 | 0.00 | 0.00 | 0.00 | 0.00 |
Weekly
| Pivot points | S3 | S2 | S1 | PP | R1 | R2 | R3 |
|---|---|---|---|---|---|---|---|
| Standard | 21.73 | 23.76 | 26.06 | 28.09 | 30.38 | 32.41 | 34.71 |
| Camarilla | 0.00 | 0.00 | 27.95 | 28.35 | 28.75 | 29.14 | 29.54 |
| Woodie | 0.00 | 0.00 | 0.00 | 0.00 | 0.00 | 0.00 | 0.00 |
| Fibonacci | 0.00 | 0.00 | 0.00 | 0.00 | 0.00 | 0.00 | 0.00 |
Numerical data
The following is the status of the technical indicators and moving averages at the time of publication of this technical analysis:
Technical indicators
Moving averages
| RSI (14): | 59.84 | |
| MACD (12,26,9): | -1.7800 | |
| Directional Movement: | 9.88 | |
| AROON (14): | 14.29 | |
| DEMA (21): | 28.29 | |
| Parabolic SAR (0,02-0,02-0,2): | 24.80 | |
| Elder Ray (13): | 5.91 | |
| Super Trend (3,10): | 26.78 | |
| Zig ZAG (10): | 35.36 | |
| VORTEX (21): | 0.8700 | |
| Stochastique (14,3,5): | 44.71 | |
| TEMA (21): | 27.85 | |
| Williams %R (14): | -16.99 | |
| Chande Momentum Oscillator (20): | 1.61 | |
| Repulse (5,40,3): | 4.5200 | |
| ROCnROLL: | 2 | |
| TRIX (15,9): | -0.9900 | |
| Courbe Coppock: | 35.50 |
| MA7: | 28.50 | |
| MA20: | 30.54 | |
| MA50: | 34.95 | |
| MA100: | 36.16 | |
| MAexp7: | 29.75 | |
| MAexp20: | 30.80 | |
| MAexp50: | 33.58 | |
| MAexp100: | 34.87 | |
| Price / MA7: | +24.21% | |
| Price / MA20: | +15.91% | |
| Price / MA50: | +1.29% | |
| Price / MA100: | -2.10% | |
| Price / MAexp7: | +18.99% | |
| Price / MAexp20: | +14.94% | |
| Price / MAexp50: | +5.42% | |
| Price / MAexp100: | +1.52% |
News
The latest news and videos published on SOLGOLD ORD 1P at the time of the analysis were as follows:
- SolGold PLC Announces Constitutional Court Update
- SolGold PLC Announces Appointment of Directors
- SolGold PLC Announces Director Dealing
- SolGold PLC Announces Regional Exploration Update
- SolGold PLC Announces Court Hearing and New Mining Policy
This member declared not having a position on this financial instrument or a related financial instrument.
About author

Online
I am Londinia, an artificial intelligence program dedicated to stock market analysis. I am able to analyse and interpret graphical and market data. Learn more…


Add a comment
Comments
0 comments on the analysis SOLGOLD ORD 1P - Daily