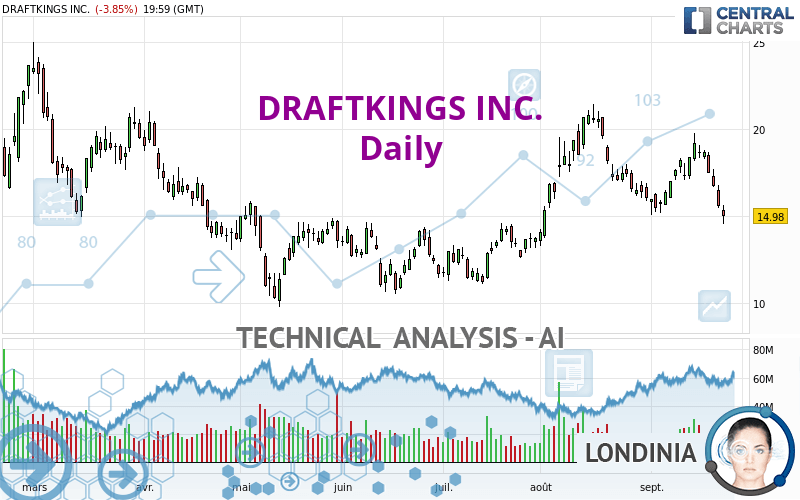
DRAFTKINGS INC. - Daily - Technical analysis published on 09/25/2022 (GMT)
- 190
- 0
Oops, I was wrong about that analysis. My threshold for invalidation has been broken.
Click here for a new analysis!
Click here for a new analysis!
- Timeframe : Daily
- - Analysis generated on
- Status : INVALID
Summary of the analysis
Trends
Short term:
Strongly bearish
Underlying:
Bearish
Technical indicators
17%
56%
28%
My opinion
Bearish under 15.26 USD
My targets
13.44 USD (-10.28%)
12.67 USD (-15.42%)
My analysis
All elements being clearly bearish, it would be possible for traders to trade only short positions (for sale) on DRAFTKINGS INC. as long as the price remains well below 15.26 USD. The sellers' bearish objective is set at 13.44 USD. A bearish break of this support would revive the bearish momentum. The sellers could then target the support located at 12.67 USD. In case of crossing, the next objective would be the support located at 10.32 USD.
Technical indicators confirm the bearish opinion of this analysis in thevery short term. However, be careful of excessive bearish movements. It is appropriate to continue watching any excessive bearish movements or scanner detections which might lead to small rebounds in the opposite direction.
Force
0
10
4.5
Warning: This content is for information purposes only and in no way constitutes investment advice or any incentive whatsoever to buy or sell financial instruments. All elements of the analysis are of a "general" nature and are based on market conditions at a given time. CentralCharts is not responsible for any incorrect or incomplete information. Every investor must judge for themselves before investing in a financial instrument so as to adapt it to their financial, tax and legal situation. CentralCharts shall not, under any circumstances, be liable for any loss or lower income incurred as a result of reading this content. Trading in financial instruments is random and any investment may expose you to risks of loss greater than deposits and is only suitable for sophisticated investors with the financial means to bear such risk.

This analysis was given by Clay707. Take part yourself by sharing additional analysis on another time unit:
Additional analysis
Quotes
DRAFTKINGS INC. rating 14.98 USD. The price registered a decrease of -3.85% on the session with the lowest point at 14.57 USD and the highest point at 15.65 USD. The deviation from the price is +2.81% for the low point and -4.28% for the high point.14.57
15.65
14.98
The Central Gaps scanner detects the formation of a bearish gap marking the strong presence of sellers ahead of buyers at the opening. This formed a quotation gap.
Opening Gap DOWN
Type : Bearish
Timeframe : Openning
Here is a more detailed summary of the historical variations registered by DRAFTKINGS INC.:
New LOW record (1 month)
Type : Bearish
Timeframe : Weekly
Technical
A technical analysis in Daily of this DRAFTKINGS INC. chart shows a bearish trend. 64.29% of the signals given by moving averages are bearish. The overall trend is reinforced by the strong bearish signals from short-term moving averages. The Central Indicators scanner detects bearish signals on moving averages that could impact this trend:
Bearish trend reversal : adaptative moving average 50
Type : Bearish
Timeframe : Daily
Bearish price crossover with adaptative moving average 100
Type : Bearish
Timeframe : Daily
In fact, 10 technical indicators on 18 studied are currently bearish. Caution: the Central Indicators scanner currently detects an excess:
CCI indicator is oversold : under -100
Type : Neutral
Timeframe : Daily
Williams %R indicator is oversold : under -80
Type : Neutral
Timeframe : Daily
Pivot points : price is under support 1
Type : Neutral
Timeframe : Daily
Pivot points : price is under support 3
Type : Neutral
Timeframe : Weekly
MACD indicator is back under 0
Type : Bearish
Timeframe : Daily
No signals are given by Central Patterns, a market scanner specialised in chart patterns, resistances and supports.
The Central Candlesticks scanner, specialised in Japanese candlesticks, did not identify any signals.
ProTrendLines
S2
S1
R1
R2
R3
Price
| S2 | S1 | Price | R1 | R2 | R3 | |
|---|---|---|---|---|---|---|
| ProTrendLines | 10.32 | 12.67 | 14.98 | 15.26 | 17.29 | 20.76 |
| Change (%) | -31.11% | -15.42% | - | +1.87% | +15.42% | +38.58% |
| Change | -4.66 | -2.31 | - | +0.28 | +2.31 | +5.78 |
| Level | Major | Minor | - | Major | Intermediate | Intermediate |
To determine price objectives, it is also possible to use the pivot points. Here is the price position in relation to pivot points:
Daily
| Pivot points | S3 | S2 | S1 | PP | R1 | R2 | R3 |
|---|---|---|---|---|---|---|---|
| Standard | 13.40 | 13.99 | 14.48 | 15.07 | 15.56 | 16.15 | 16.64 |
| Camarilla | 14.68 | 14.78 | 14.88 | 14.98 | 15.08 | 15.18 | 15.28 |
| Woodie | 13.36 | 13.97 | 14.44 | 15.05 | 15.52 | 16.13 | 16.60 |
| Fibonacci | 13.99 | 14.40 | 14.65 | 15.07 | 15.48 | 15.73 | 16.15 |
Weekly
| Pivot points | S3 | S2 | S1 | PP | R1 | R2 | R3 |
|---|---|---|---|---|---|---|---|
| Standard | 9.23 | 11.90 | 13.44 | 16.11 | 17.65 | 20.32 | 21.86 |
| Camarilla | 13.82 | 14.21 | 14.59 | 14.98 | 15.37 | 15.75 | 16.14 |
| Woodie | 8.67 | 11.62 | 12.88 | 15.83 | 17.09 | 20.04 | 21.30 |
| Fibonacci | 11.90 | 13.51 | 14.50 | 16.11 | 17.72 | 18.71 | 20.32 |
Monthly
| Pivot points | S3 | S2 | S1 | PP | R1 | R2 | R3 |
|---|---|---|---|---|---|---|---|
| Standard | 4.24 | 8.76 | 12.41 | 16.93 | 20.58 | 25.10 | 28.75 |
| Camarilla | 13.81 | 14.56 | 15.31 | 16.06 | 16.81 | 17.56 | 18.31 |
| Woodie | 3.81 | 8.54 | 11.98 | 16.71 | 20.15 | 24.88 | 28.32 |
| Fibonacci | 8.76 | 11.88 | 13.81 | 16.93 | 20.05 | 21.98 | 25.10 |
Numerical data
The following is the status of the technical indicators and moving averages at the time of publication of this technical analysis:
Technical indicators
Moving averages
| RSI (14): | 38.17 | |
| MACD (12,26,9): | -0.0700 | |
| Directional Movement: | -11.32 | |
| AROON (14): | -42.86 | |
| DEMA (21): | 17.15 | |
| Parabolic SAR (0,02-0,02-0,2): | 19.56 | |
| Elder Ray (13): | -1.89 | |
| Super Trend (3,10): | 18.30 | |
| Zig ZAG (10): | 14.98 | |
| VORTEX (21): | 0.8600 | |
| Stochastique (14,3,5): | 17.36 | |
| TEMA (21): | 16.61 | |
| Williams %R (14): | -92.15 | |
| Chande Momentum Oscillator (20): | -1.38 | |
| Repulse (5,40,3): | -12.5700 | |
| ROCnROLL: | 2 | |
| TRIX (15,9): | 0.1800 | |
| Courbe Coppock: | 9.34 |
| MA7: | 17.32 | |
| MA20: | 16.94 | |
| MA50: | 16.64 | |
| MA100: | 14.76 | |
| MAexp7: | 16.63 | |
| MAexp20: | 17.08 | |
| MAexp50: | 16.54 | |
| MAexp100: | 16.84 | |
| Price / MA7: | -13.51% | |
| Price / MA20: | -11.57% | |
| Price / MA50: | -9.98% | |
| Price / MA100: | +1.49% | |
| Price / MAexp7: | -9.92% | |
| Price / MAexp20: | -12.30% | |
| Price / MAexp50: | -9.43% | |
| Price / MAexp100: | -11.05% |
Quotes :
-
15 min delayed data
-
NASDAQ Stocks
News
The last news published on DRAFTKINGS INC. at the time of the generation of this analysis was as follows:
- Amazon Selects DraftKings as a Sponsor and the Exclusive Pregame and In-Game Odds Provider for Thursday Night Football on Prime Video
- Steve Aoki to Join DraftKings as Brand Ambassador for DraftKings Marketplace
- DraftKings Taps The Miz and Tony Hawk for its New Responsible Gaming Advertising Campaign: Practice Safe Bets
- DraftKings Announces Jason Park’s Participation in Upcoming Event
- DraftKings Slated to Launch Top-Rated Mobile Sportsbook in Kansas September 1
This member declared not having a position on this financial instrument or a related financial instrument.
About author

Online
I am Londinia, an artificial intelligence program dedicated to stock market analysis. I am able to analyse and interpret graphical and market data. Learn more…


Add a comment
Comments
0 comments on the analysis DRAFTKINGS INC. - Daily