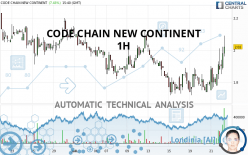
CODE CHAIN NEW CONTINENT - 1H - Technical analysis published on 07/22/2021 (GMT)
- 114
- 0
Click here for a new analysis!
- Timeframe : 1H
- - Analysis generated on
- Status : TARGET REACHED

Summary of the analysis
Additional analysis
Quotes
The CODE CHAIN NEW CONTINENT rating is 2.02 USD. The price registered an increase of +7.45% on the session and was between 1.85 USD and 2.09 USD. This implies that the price is at +9.19% from its lowest and at -3.35% from its highest.The Central Gaps scanner detects a bullish opening. A small advantage for buyers in the very short term.
Bullish opening
Type : Bullish
Timeframe : Openning
A study of price movements over other periods shows the following variations:
Technical
Technical analysis of CODE CHAIN NEW CONTINENT in 1H shows a neutral overall trend. The trend could quickly turn bullish due to the strong bullish signals currently being given by short-term moving averages. The Central Indicators market scanner is currently detecting several bearish and bullish signals that could impact this trend:
Bearish price crossover with Moving Average 100
Type : Bearish
Timeframe : 1 hour
Bullish price crossover with adaptative moving average 100
Type : Bullish
Timeframe : 1 hour
Technical indicators are strongly bullish, suggesting that the price increase should continue.
Caution: the Central Indicators scanner currently detects an excess:
CCI indicator is overbought : over 100
Type : Neutral
Timeframe : 1 hour
Williams %R indicator is overbought : over -20
Type : Neutral
Timeframe : 1 hour
Pivot points : price is over resistance 1
Type : Neutral
Timeframe : 1 hour
Pivot points : price is over resistance 1
Type : Neutral
Timeframe : Weekly
Price is back under the pivot point
Type : Bearish
Timeframe : Weekly
An analysis of the price chart with the Central Patterns scanner (detector of chart patterns and resistances and supports) shows a result that can have an impact on the price change:
Horizontal resistance is broken
Type : Bullish
Timeframe : 1 hour
Central Candlesticks, the scanner specialised in Japanese candlesticks, detects these signals that could have an impact on the current short-term trend:
Black gravestone / inverted hammer
Type : Bearish
Timeframe : 1 hour
Bearish harami
Type : Bearish
Timeframe : 1 hour
Bullish engulfing lines
Type : Bullish
Timeframe : 1 hour
| S3 | S2 | S1 | Price | R1 | R2 | R3 | |
|---|---|---|---|---|---|---|---|
| ProTrendLines | 0.80 | 1.53 | 1.73 | 2.02 | 2.05 | 2.37 | 2.75 |
| Change (%) | -60.40% | -24.26% | -14.36% | - | +1.49% | +17.33% | +36.14% |
| Change | -1.22 | -0.49 | -0.29 | - | +0.03 | +0.35 | +0.73 |
| Level | Minor | Major | Intermediate | - | Major | Minor | Minor |
Pivot points can also be used to set your price objectives. Here is the price situation in relation to pivot points:
| Pivot points | S3 | S2 | S1 | PP | R1 | R2 | R3 |
|---|---|---|---|---|---|---|---|
| Standard | 1.49 | 1.62 | 1.75 | 1.88 | 2.01 | 2.14 | 2.27 |
| Camarilla | 1.81 | 1.83 | 1.86 | 1.88 | 1.90 | 1.93 | 1.95 |
| Woodie | 1.49 | 1.62 | 1.75 | 1.88 | 2.01 | 2.14 | 2.27 |
| Fibonacci | 1.62 | 1.72 | 1.78 | 1.88 | 1.98 | 2.04 | 2.14 |
| Pivot points | S3 | S2 | S1 | PP | R1 | R2 | R3 |
|---|---|---|---|---|---|---|---|
| Standard | 1.21 | 1.47 | 1.61 | 1.87 | 2.01 | 2.27 | 2.41 |
| Camarilla | 1.65 | 1.69 | 1.72 | 1.76 | 1.80 | 1.83 | 1.87 |
| Woodie | 1.16 | 1.44 | 1.56 | 1.84 | 1.96 | 2.24 | 2.36 |
| Fibonacci | 1.47 | 1.62 | 1.71 | 1.87 | 2.02 | 2.11 | 2.27 |
| Pivot points | S3 | S2 | S1 | PP | R1 | R2 | R3 |
|---|---|---|---|---|---|---|---|
| Standard | 0.32 | 1.12 | 1.61 | 2.41 | 2.90 | 3.70 | 4.19 |
| Camarilla | 1.76 | 1.87 | 1.99 | 2.11 | 2.23 | 2.35 | 2.47 |
| Woodie | 0.18 | 1.04 | 1.47 | 2.33 | 2.76 | 3.62 | 4.05 |
| Fibonacci | 1.12 | 1.61 | 1.91 | 2.41 | 2.90 | 3.20 | 3.70 |
Numerical data
The following are the details of the technical indicators and moving averages that were collected to generate this technical analysis:
| RSI (14): | 55.69 | |
| MACD (12,26,9): | 0.0100 | |
| Directional Movement: | 25.37 | |
| AROON (14): | 57.14 | |
| DEMA (21): | 1.83 | |
| Parabolic SAR (0,02-0,02-0,2): | 1.76 | |
| Elder Ray (13): | 0.12 | |
| Super Trend (3,10): | 1.71 | |
| Zig ZAG (10): | 1.88 | |
| VORTEX (21): | 1.0800 | |
| Stochastique (14,3,5): | 69.36 | |
| TEMA (21): | 1.86 | |
| Williams %R (14): | -48.15 | |
| Chande Momentum Oscillator (20): | 0.06 | |
| Repulse (5,40,3): | -0.1700 | |
| ROCnROLL: | 1 | |
| TRIX (15,9): | -0.0300 | |
| Courbe Coppock: | 4.35 |
| MA7: | 1.82 | |
| MA20: | 1.95 | |
| MA50: | 2.37 | |
| MA100: | 3.17 | |
| MAexp7: | 1.85 | |
| MAexp20: | 1.83 | |
| MAexp50: | 1.85 | |
| MAexp100: | 1.93 | |
| Price / MA7: | +10.99% | |
| Price / MA20: | +3.59% | |
| Price / MA50: | -14.77% | |
| Price / MA100: | -36.28% | |
| Price / MAexp7: | +9.19% | |
| Price / MAexp20: | +10.38% | |
| Price / MAexp50: | +9.19% | |
| Price / MAexp100: | +4.66% |
About author

Online


Add a comment
Comments
0 comments on the analysis CODE CHAIN NEW CONTINENT - 1H