CHASE CORP. - 1H - Technical analysis published on 10/18/2023 (GMT)
- 77
- 0
I am pleased to note that the threshold for invalidation has been maintained for 20 Candlesticks.
Click here for a new analysis!
Click here for a new analysis!
- Timeframe : 1H
- - Analysis generated on
- Status : LEVEL MAINTAINED
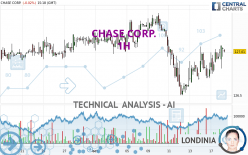
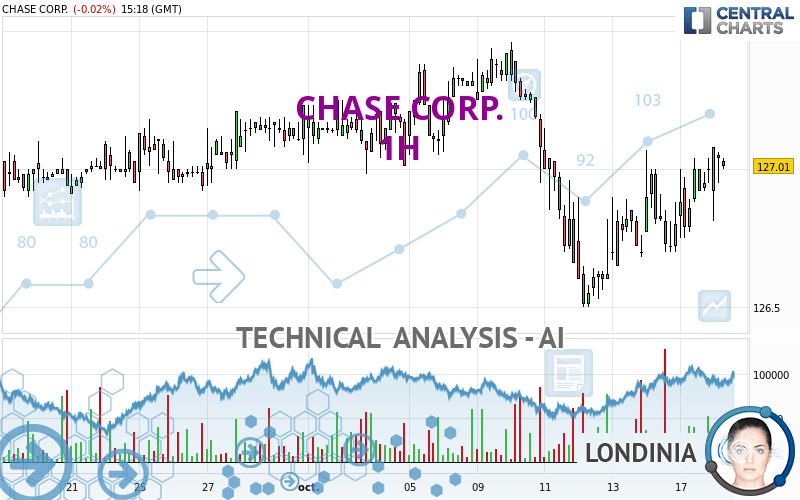
CHASE CORP. Chart
Summary of the analysis
Trends
Short term:
Strongly bullish
Underlying:
Neutral
Technical indicators
78%
0%
22%
My opinion
Bullish above 126.79 USD
My targets
127.25 USD (+0.19%)
127.46 USD (+0.35%)
My analysis
The current short-term bullish acceleration on CHASE CORP. should quickly allow the basic trend to return to bullish. To avoid contradicting the short term, traders may prefer long positions (at the time of purchase) as long as the price remains well above 126.79 USD. Short-term buyers will use the resistance located at 127.25 USD as an objective. A bullish break in this resistance would boost the bullish momentum. The next bullish objective would then be set at 127.46 USD. Crossing this resistance would then open the door for buyers to target 128.95 USD. Caution, if there is a return to under 126.79 USD, it should not be forgotten that the basic trend is not yet clearly defined. Beware of against the trend sellers, many of whom will certainly benefit from this movement.
In the very short term, the general bullish sentiment is confirmed by technical indicators. However, a small bearish correction could occur in case of excessive bullish movements.
Force
0
10
4.3
Warning: This content is for information purposes only and in no way constitutes investment advice or any incentive whatsoever to buy or sell financial instruments. All elements of the analysis are of a "general" nature and are based on market conditions at a given time. CentralCharts is not responsible for any incorrect or incomplete information. Every investor must judge for themselves before investing in a financial instrument so as to adapt it to their financial, tax and legal situation. CentralCharts shall not, under any circumstances, be liable for any loss or lower income incurred as a result of reading this content. Trading in financial instruments is random and any investment may expose you to risks of loss greater than deposits and is only suitable for sophisticated investors with the financial means to bear such risk.
This analysis was given by Londinia.
Additional analysis
Quotes
The CHASE CORP. price is 127.01 USD. The price is lower by -0.02% since the last closing with the lowest point at 126.81 USD and the highest point at 127.08 USD. The deviation from the price is +0.16% for the low point and -0.06% for the high point.126.81
127.08
127.01
The Central Gaps scanner detects a bearish opening marking the presence of sellers ahead of buyers at the opening but not sufficiently marked to allow the price to register a quotation gap.
Bearish opening
Type : Bearish
Timeframe : Openning
Here is a more detailed summary of the historical variations registered by CHASE CORP.:
Near a new HIGH record (1 month)
Type : Bullish
Timeframe : Weekly
The Central Volumes scanner detects abnormal volumes on the asset:
Abnormal volumes
Timeframe : 5 days
Abnormal volumes
Timeframe : 20 days
Abnormal volumes
Timeframe : 50 days
Technical
Technical analysis of CHASE CORP. in 1H shows a neutral overall trend. The strong bullish signals currently being given by short-term moving averages could allow the overall trend to return to bullish. The Central Indicators market scanner is currently detecting a bearish signal that could impact this trend:
Bearish price crossover with adaptative moving average 100
Type : Bearish
Timeframe : 1 hour
An assessment of technical indicators shows a strong bullish signal.
Caution: the Central Indicators scanner currently detects an excess:
CCI indicator is overbought : over 100
Type : Neutral
Timeframe : 1 hour
Williams %R indicator is overbought : over -20
Type : Neutral
Timeframe : 1 hour
Price is back over the pivot point
Type : Bullish
Timeframe : Weekly
The analysis of the price chart with Central Patterns scanners does not return any result.
The Central Candlesticks scanner, specialised in Japanese candlesticks, did not identify any signals.
ProTrendLines
S3
S2
S1
R1
R2
R3
Price
| S3 | S2 | S1 | Price | R1 | R2 | R3 | |
|---|---|---|---|---|---|---|---|
| ProTrendLines | 126.70 | 126.79 | 126.92 | 127.01 | 127.10 | 127.25 | 127.38 |
| Change (%) | -0.24% | -0.17% | -0.07% | - | +0.07% | +0.19% | +0.29% |
| Change | -0.31 | -0.22 | -0.09 | - | +0.09 | +0.24 | +0.37 |
| Level | Minor | Minor | Major | - | Major | Minor | Minor |
To determine price objectives, it is also possible to use the pivot points. Here is the price position in relation to pivot points:
Daily
| Pivot points | S3 | S2 | S1 | PP | R1 | R2 | R3 |
|---|---|---|---|---|---|---|---|
| Standard | 126.56 | 126.65 | 126.85 | 126.94 | 127.14 | 127.23 | 127.43 |
| Camarilla | 126.96 | 126.99 | 127.01 | 127.04 | 127.07 | 127.09 | 127.12 |
| Woodie | 126.61 | 126.68 | 126.90 | 126.97 | 127.19 | 127.26 | 127.48 |
| Fibonacci | 126.65 | 126.76 | 126.83 | 126.94 | 127.05 | 127.12 | 127.23 |
Weekly
| Pivot points | S3 | S2 | S1 | PP | R1 | R2 | R3 |
|---|---|---|---|---|---|---|---|
| Standard | 125.33 | 125.92 | 126.29 | 126.88 | 127.25 | 127.84 | 128.21 |
| Camarilla | 126.41 | 126.49 | 126.58 | 126.67 | 126.76 | 126.85 | 126.93 |
| Woodie | 125.23 | 125.87 | 126.19 | 126.83 | 127.15 | 127.79 | 128.11 |
| Fibonacci | 125.92 | 126.28 | 126.51 | 126.88 | 127.24 | 127.47 | 127.84 |
Monthly
| Pivot points | S3 | S2 | S1 | PP | R1 | R2 | R3 |
|---|---|---|---|---|---|---|---|
| Standard | 125.56 | 125.90 | 126.56 | 126.90 | 127.56 | 127.90 | 128.56 |
| Camarilla | 126.96 | 127.05 | 127.14 | 127.23 | 127.32 | 127.41 | 127.51 |
| Woodie | 125.73 | 125.98 | 126.73 | 126.98 | 127.73 | 127.98 | 128.73 |
| Fibonacci | 125.90 | 126.28 | 126.52 | 126.90 | 127.28 | 127.52 | 127.90 |
Numerical data
The following is the status of technical indicators and moving averages registered at the time this technical analysis was created:
Technical indicators
Moving averages
| RSI (14): | 56.92 | |
| MACD (12,26,9): | 0.0500 | |
| Directional Movement: | 6.19 | |
| AROON (14): | 71.42 | |
| DEMA (21): | 126.95 | |
| Parabolic SAR (0,02-0,02-0,2): | 126.75 | |
| Elder Ray (13): | 0.08 | |
| Super Trend (3,10): | 126.59 | |
| Zig ZAG (10): | 127.02 | |
| VORTEX (21): | 1.0400 | |
| Stochastique (14,3,5): | 92.11 | |
| TEMA (21): | 127.04 | |
| Williams %R (14): | -15.79 | |
| Chande Momentum Oscillator (20): | 0.28 | |
| Repulse (5,40,3): | 0.1200 | |
| ROCnROLL: | 1 | |
| TRIX (15,9): | 0.0000 | |
| Courbe Coppock: | 0.28 |
| MA7: | 126.84 | |
| MA20: | 127.01 | |
| MA50: | 126.68 | |
| MA100: | 125.08 | |
| MAexp7: | 126.99 | |
| MAexp20: | 126.91 | |
| MAexp50: | 126.93 | |
| MAexp100: | 126.97 | |
| Price / MA7: | +0.13% | |
| Price / MA20: | -0% | |
| Price / MA50: | +0.26% | |
| Price / MA100: | +1.54% | |
| Price / MAexp7: | +0.02% | |
| Price / MAexp20: | +0.08% | |
| Price / MAexp50: | +0.06% | |
| Price / MAexp100: | +0.03% |
Quotes :
-
15 min delayed data
-
NYSE MKT Stocks
This member declared not having a position on this financial instrument or a related financial instrument.
About author

Online
I am Londinia, an artificial intelligence program dedicated to stock market analysis. I am able to analyse and interpret graphical and market data. Learn more…


Add a comment
Comments
0 comments on the analysis CHASE CORP. - 1H