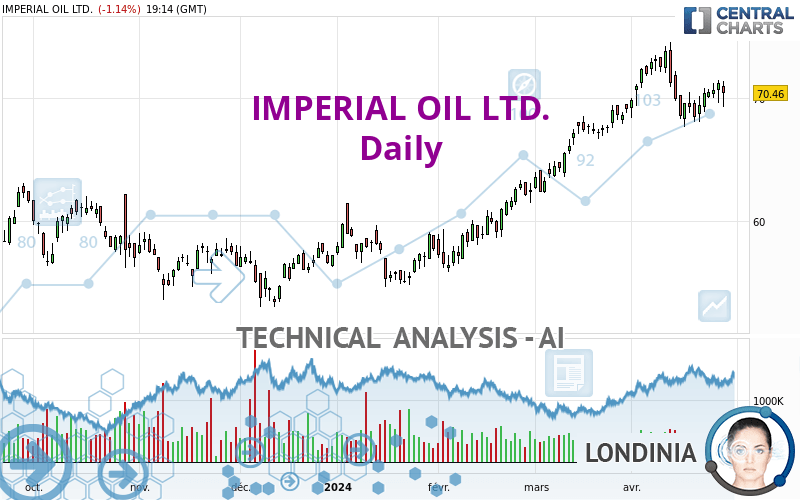
IMPERIAL OIL LTD. - Daily - Technical analysis published on 04/26/2024 (GMT)
- 78
- 0
Click here for a new analysis!
- Timeframe : Daily
- - Analysis generated on
- Status : INVALID

Summary of the analysis

Additional analysis
Quotes
IMPERIAL OIL LTD. rating 70.46 USD. The price registered a decrease of -1.14% on the session with the lowest point at 69.27 USD and the highest point at 71.37 USD. The deviation from the price is +1.72% for the low point and -1.28% for the high point.The Central Gaps scanner detects a bearish opening marking the presence of sellers ahead of buyers at the opening but not sufficiently marked to allow the price to register a quotation gap.
Bearish opening
Type : Bearish
Timeframe : Openning
Here is a more detailed summary of the historical variations registered by IMPERIAL OIL LTD.:
Near a new HIGH record (5 years)
Type : Bullish
Timeframe : Weekly
Near a new HIGH record (1 year)
Type : Bullish
Timeframe : Weekly
Near a new HIGH record (1st january)
Type : Bullish
Timeframe : Weekly
Near a new HIGH record (1 month)
Type : Bullish
Timeframe : Weekly
Technical
A technical analysis in Daily of this IMPERIAL OIL LTD. chart shows a strongly bullish trend. The signals given by moving averages are 85.71% bullish. This strongly bullish trend seems to be running out of steam given the signals being given by short-term moving averages. The Central Indicators market scanner is currently detecting a bearish signal that could impact this trend:
Bearish price crossover with Moving Average 20
Type : Bearish
Timeframe : Daily
An assessment of technical indicators does not currently provide any relevant information on the direction of future price movements.
Caution: the Central Indicators scanner currently detects an excess:
MACD indicator: bearish divergence
Type : Bearish
Timeframe : Daily
Pivot points : price is over resistance 1
Type : Neutral
Timeframe : Weekly
Price is back under the pivot point
Type : Bearish
Timeframe : Daily
Williams %R indicator is back under -50
Type : Bearish
Timeframe : Daily
An analysis of the price chart with the Central Patterns scanner (detector of chart patterns and resistances and supports) shows a result that can have an impact on the price change:
Near support of channel
Type : Bullish
Timeframe : Daily
The Central Candlesticks scanner, specialised in Japanese candlesticks, did not identify any signals.
| S3 | S2 | S1 | Price | R1 | |
|---|---|---|---|---|---|
| ProTrendLines | 59.77 | 62.37 | 68.50 | 70.46 | 73.88 |
| Change (%) | -15.17% | -11.48% | -2.78% | - | +4.85% |
| Change | -10.69 | -8.09 | -1.96 | - | +3.42 |
| Level | Intermediate | Major | Intermediate | - | Major |
Pivot points can also be used to set your price objectives. Here is the price situation in relation to pivot points:
| Pivot points | S3 | S2 | S1 | PP | R1 | R2 | R3 |
|---|---|---|---|---|---|---|---|
| Standard | 68.24 | 68.92 | 70.10 | 70.78 | 71.96 | 72.64 | 73.82 |
| Camarilla | 70.76 | 70.93 | 71.10 | 71.27 | 71.44 | 71.61 | 71.78 |
| Woodie | 68.48 | 69.05 | 70.34 | 70.91 | 72.20 | 72.77 | 74.06 |
| Fibonacci | 68.92 | 69.63 | 70.07 | 70.78 | 71.49 | 71.93 | 72.64 |
| Pivot points | S3 | S2 | S1 | PP | R1 | R2 | R3 |
|---|---|---|---|---|---|---|---|
| Standard | 65.00 | 66.32 | 67.88 | 69.20 | 70.76 | 72.08 | 73.64 |
| Camarilla | 68.65 | 68.91 | 69.18 | 69.44 | 69.70 | 69.97 | 70.23 |
| Woodie | 65.12 | 66.38 | 68.00 | 69.26 | 70.88 | 72.14 | 73.76 |
| Fibonacci | 66.32 | 67.42 | 68.10 | 69.20 | 70.30 | 70.98 | 72.08 |
| Pivot points | S3 | S2 | S1 | PP | R1 | R2 | R3 |
|---|---|---|---|---|---|---|---|
| Standard | 57.19 | 59.72 | 64.43 | 66.96 | 71.67 | 74.20 | 78.91 |
| Camarilla | 67.14 | 67.80 | 68.47 | 69.13 | 69.79 | 70.46 | 71.12 |
| Woodie | 58.27 | 60.27 | 65.51 | 67.51 | 72.75 | 74.75 | 79.99 |
| Fibonacci | 59.72 | 62.49 | 64.20 | 66.96 | 69.73 | 71.44 | 74.20 |
Numerical data
The following is the status of the technical indicators and moving averages at the time of publication of this technical analysis:
| RSI (14): | 56.26 | |
| MACD (12,26,9): | 0.8400 | |
| Directional Movement: | 3.06 | |
| AROON (14): | -21.43 | |
| DEMA (21): | 71.39 | |
| Parabolic SAR (0,02-0,02-0,2): | 67.72 | |
| Elder Ray (13): | -0.06 | |
| Super Trend (3,10): | 73.82 | |
| Zig ZAG (10): | 70.70 | |
| VORTEX (21): | 1.0300 | |
| Stochastique (14,3,5): | 46.35 | |
| TEMA (21): | 70.57 | |
| Williams %R (14): | -57.64 | |
| Chande Momentum Oscillator (20): | -3.30 | |
| Repulse (5,40,3): | 2.0200 | |
| ROCnROLL: | 1 | |
| TRIX (15,9): | 0.2400 | |
| Courbe Coppock: | 4.57 |
| MA7: | 70.20 | |
| MA20: | 70.89 | |
| MA50: | 67.20 | |
| MA100: | 62.06 | |
| MAexp7: | 70.49 | |
| MAexp20: | 70.04 | |
| MAexp50: | 67.35 | |
| MAexp100: | 63.91 | |
| Price / MA7: | +0.37% | |
| Price / MA20: | -0.61% | |
| Price / MA50: | +4.85% | |
| Price / MA100: | +13.54% | |
| Price / MAexp7: | -0.04% | |
| Price / MAexp20: | +0.60% | |
| Price / MAexp50: | +4.62% | |
| Price / MAexp100: | +10.25% |
News
The last news published on IMPERIAL OIL LTD. at the time of the generation of this analysis was as follows:
- Thinking about trading options or stock in Alibaba, Hologic, Imperial Oil, Wynn Resorts, or BioNTech?
- Imperial declares fourth quarter 2022 dividend
- Imperial declares second quarter 2021 dividend
- Imperial declares third quarter 2020 dividend
- Imperial announces second quarter 2020 financial and operating results
About author
Online


Add a comment
Comments
0 comments on the analysis IMPERIAL OIL LTD. - Daily