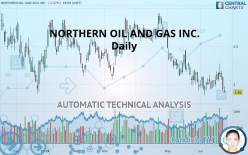
NORTHERN OIL AND GAS INC. - Daily - Technical analysis published on 06/26/2019 (GMT)
- Who voted?
- 239
- 0
Click here for a new analysis!
- Timeframe : Daily
- - Analysis generated on
- Status : INVALID

Summary of the analysis

Additional analysis
Quotes
The NORTHERN OIL AND GAS INC. rating is 1.89 USD. The price registered a decrease of -2.07% on the session and was between 1.88 USD and 1.97 USD. This implies that the price is at +0.53% from its lowest and at -4.06% from its highest.The Central Gaps scanner detects a bullish opening marking the presence of sellers ahead of buyers at the opening but not sufficiently marked to allow the price to register a quotation gap.
Bearish opening
Type : Bearish
Timeframe : Openning
Here is a more detailed summary of the historical variations registered by NORTHERN OIL AND GAS INC.:
Near a new LOW record (1 year)
Type : Bearish
Timeframe : Weekly
Near a new LOW record (1st january)
Type : Bearish
Timeframe : Weekly
Near a new LOW record (1 month)
Type : Bearish
Timeframe : Weekly
Technical
Technical analysis of this Daily chart of NORTHERN OIL AND GAS INC. indicates that the overall trend is strongly bearish. The signals given by moving averages are 92.86% bearish. This strong bearish trend is confirmed by the strong signals currently being given by short-term moving averages. The Central Indicators market scanner is currently detecting several bearish signals that could impact this trend:
Bearish trend reversal : Moving Average 20
Type : Bearish
Timeframe : Daily
Bearish trend reversal : adaptative moving average 20
Type : Bearish
Timeframe : Daily
Bearish price crossover with Moving Average 20
Type : Bearish
Timeframe : Daily
In fact, according to the parameters integrated into the Central Analyzer system, 10 technical indicators out of 18 analysed are currently bearish. But beware of excesses. The Central Indicators scanner currently detects this:
Williams %R indicator is oversold : under -80
Type : Neutral
Timeframe : Daily
Pivot points : price is under support 1
Type : Neutral
Timeframe : Weekly
Parabolic SAR indicator bearish reversal
Type : Bearish
Timeframe : Daily
Price is back under the pivot point
Type : Bearish
Timeframe : Daily
Momentum indicator is back under 0
Type : Bearish
Timeframe : Daily
Williams %R indicator is back under -50
Type : Bearish
Timeframe : Daily
The Central Patterns scanner, which studies chart patterns, resistances and supports, has identified this signal:
Near support of channel
Type : Bullish
Timeframe : Daily
The Central Candlesticks scanner, specialised in Japanese candlesticks, did not identify any signals.
| S3 | S2 | S1 | Price | R1 | R2 | R3 | |
|---|---|---|---|---|---|---|---|
| ProTrendLines | 0.65 | 1.05 | 1.75 | 1.89 | 1.94 | 2.90 | 3.15 |
| Change (%) | -65.61% | -44.44% | -7.41% | - | +2.65% | +53.44% | +66.67% |
| Change | -1.24 | -0.84 | -0.14 | - | +0.05 | +1.01 | +1.26 |
| Level | Minor | Minor | Major | - | Major | Intermediate | Minor |
To determine price objectives, it is also possible to use the pivot points. Here is the price position in relation to pivot points:
| Pivot points | S3 | S2 | S1 | PP | R1 | R2 | R3 |
|---|---|---|---|---|---|---|---|
| Standard | 1.67 | 1.79 | 1.86 | 1.98 | 2.05 | 2.17 | 2.24 |
| Camarilla | 1.88 | 1.90 | 1.91 | 1.93 | 1.95 | 1.96 | 1.98 |
| Woodie | 1.64 | 1.78 | 1.84 | 1.97 | 2.03 | 2.16 | 2.21 |
| Fibonacci | 1.79 | 1.86 | 1.91 | 1.98 | 2.05 | 2.10 | 2.17 |
| Pivot points | S3 | S2 | S1 | PP | R1 | R2 | R3 |
|---|---|---|---|---|---|---|---|
| Standard | 1.65 | 1.81 | 1.95 | 2.11 | 2.25 | 2.41 | 2.55 |
| Camarilla | 2.01 | 2.04 | 2.06 | 2.09 | 2.12 | 2.14 | 2.17 |
| Woodie | 1.64 | 1.80 | 1.94 | 2.11 | 2.24 | 2.40 | 2.54 |
| Fibonacci | 1.81 | 1.92 | 2.00 | 2.11 | 2.22 | 2.30 | 2.41 |
Numerical data
The following are the details of the technical indicators and moving averages that were collected to generate this technical analysis:
| RSI (14): | 39.90 | |
| MACD (12,26,9): | -0.0600 | |
| Directional Movement: | -4.93 | |
| AROON (14): | 71.43 | |
| DEMA (21): | 1.96 | |
| Parabolic SAR (0,02-0,02-0,2): | 2.26 | |
| Elder Ray (13): | -0.11 | |
| Super Trend (3,10): | 2.33 | |
| Zig ZAG (10): | 1.89 | |
| VORTEX (21): | 0.9300 | |
| Stochastique (14,3,5): | 28.57 | |
| TEMA (21): | 1.99 | |
| Williams %R (14): | -90.48 | |
| Chande Momentum Oscillator (20): | -0.12 | |
| Repulse (5,40,3): | -12.5400 | |
| ROCnROLL: | 2 | |
| TRIX (15,9): | -0.4900 | |
| Courbe Coppock: | 0.39 |
| MA7: | 2.04 | |
| MA20: | 2.02 | |
| MA50: | 2.26 | |
| MA100: | 2.38 | |
| MAexp7: | 2.00 | |
| MAexp20: | 2.06 | |
| MAexp50: | 2.20 | |
| MAexp100: | 2.35 | |
| Price / MA7: | -7.35% | |
| Price / MA20: | -6.44% | |
| Price / MA50: | -16.37% | |
| Price / MA100: | -20.59% | |
| Price / MAexp7: | -5.50% | |
| Price / MAexp20: | -8.25% | |
| Price / MAexp50: | -14.09% | |
| Price / MAexp100: | -19.57% |
News
The latest news and videos published on NORTHERN OIL AND GAS INC. at the time of the analysis were as follows:
-
 Northern Oil and Gas, Inc. - NOG Stock Chart Technical Analysis for 05-28-2019
- Report: Developing Opportunities within NextEra Energy, Agnico Eagle Mines, PVH, Northern Oil and Gas, Jack In The Box, and Freightcar America — Future Expectations, Projections Moving into 2019
- Research Report Identifies Aldeyra Therapeutics, AAON, Douglas Dynamics, Insmed, Northern Oil and Gas, and SMART Global with Renewed Outlook — Fundamental Analysis, Calculating Forward Movement
- Research Report Identifies Northern Oil and Gas, Sprague Resources LP, Iamgold, Consol Energy, Douglas Dynamics, and Hemisphere Media Group with Renewed Outlook — Fundamental Analysis, Calculating Forward Movement
-
Northern Oil and Gas, Inc. - NOG Stock Chart Technical Analysis for 07-31-18
About author

Online


Add a comment
Comments
0 comments on the analysis NORTHERN OIL AND GAS INC. - Daily