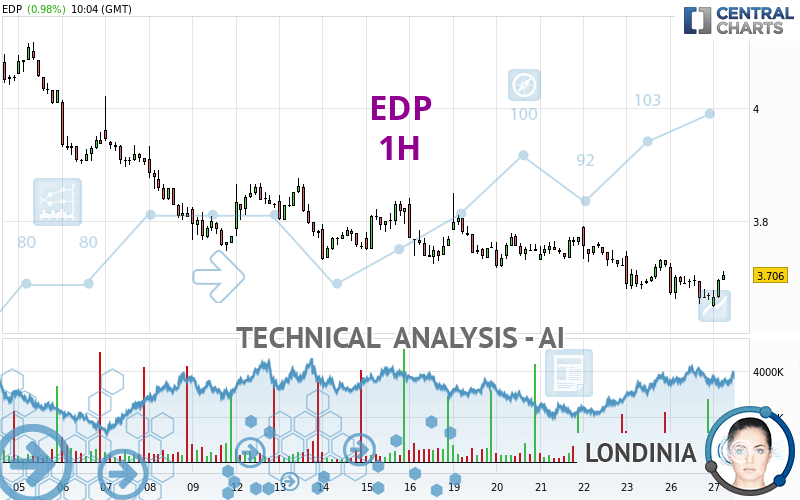
EDP - 1H - Technical analysis published on 02/27/2024 (GMT)
- 82
- 0
Click here for a new analysis!
- Timeframe : 1H
- - Analysis generated on
- Status : TARGET REACHED

Summary of the analysis

Additional analysis
Quotes
EDP rating 3.702 EUR. On the day, this instrument gained +0.87% and was traded between 3.649 EUR and 3.703 EUR over the period. The price is currently at +1.45% from its lowest and -0.03% from its highest.The Central Gaps scanner detects a bearish gap which is a sign that the sellers have taken the lead in the very short term.
Opening Gap DOWN
Type : Bearish
Timeframe : Openning
A study of price movements over other periods shows the following variations:
Near a new LOW record (1 year)
Type : Bearish
Timeframe : Weekly
New LOW record (1st january)
Type : Bearish
Timeframe : Weekly
New LOW record (1 month)
Type : Bearish
Timeframe : Weekly
Technical
A technical analysis in 1H of this EDP chart shows a bearish trend. 78.57% of the signals given by moving averages are bearish. Caution: the neutral signals currently given by short-term moving averages show us that the global trend is losing momentum. The Central Indicators scanner detects a bullish signal on moving averages that could impact this trend:
Bullish price crossover with Moving Average 20
Type : Bullish
Timeframe : 1 hour
In fact, Central Analyzer took into account 18 technical indicators and the result was as follows: 7 are bullish, 5 are neutral and 6 are bearish. Caution: the Central Indicators scanner currently detects an excess:
CCI indicator: bullish divergence
Type : Bullish
Timeframe : 1 hour
MACD crosses UP its Moving Average
Type : Bullish
Timeframe : 1 hour
Parabolic SAR indicator bullish reversal
Type : Bullish
Timeframe : 1 hour
Price is back over the pivot point
Type : Bullish
Timeframe : 1 hour
Williams %R indicator is back over -50
Type : Bullish
Timeframe : 1 hour
Central Patterns, the market scanner focusing on chart patterns, resistances and supports found this result:
Near support of triangle
Type : Bullish
Timeframe : 1 hour
No result was found by the Central Candlesticks scanner on Japanese candlesticks.
| S3 | S2 | S1 | Price | R1 | R2 | R3 | |
|---|---|---|---|---|---|---|---|
| ProTrendLines | 2.418 | 3.613 | 3.663 | 3.702 | 3.732 | 3.848 | 3.905 |
| Change (%) | -34.68% | -2.40% | -1.05% | - | +0.81% | +3.94% | +5.48% |
| Change | -1.284 | -0.089 | -0.039 | - | +0.030 | +0.146 | +0.203 |
| Level | Intermediate | Major | Intermediate | - | Intermediate | Intermediate | Major |
To determine price objectives, it is also possible to use the pivot points. Here is the price position in relation to pivot points:
| Pivot points | S3 | S2 | S1 | PP | R1 | R2 | R3 |
|---|---|---|---|---|---|---|---|
| Standard | 3.570 | 3.613 | 3.641 | 3.684 | 3.712 | 3.755 | 3.783 |
| Camarilla | 3.651 | 3.657 | 3.664 | 3.670 | 3.677 | 3.683 | 3.690 |
| Woodie | 3.564 | 3.609 | 3.635 | 3.680 | 3.706 | 3.751 | 3.777 |
| Fibonacci | 3.613 | 3.640 | 3.657 | 3.684 | 3.711 | 3.728 | 3.755 |
| Pivot points | S3 | S2 | S1 | PP | R1 | R2 | R3 |
|---|---|---|---|---|---|---|---|
| Standard | 3.482 | 3.581 | 3.652 | 3.751 | 3.822 | 3.921 | 3.992 |
| Camarilla | 3.676 | 3.692 | 3.707 | 3.723 | 3.739 | 3.754 | 3.770 |
| Woodie | 3.468 | 3.574 | 3.638 | 3.744 | 3.808 | 3.914 | 3.978 |
| Fibonacci | 3.581 | 3.646 | 3.686 | 3.751 | 3.816 | 3.856 | 3.921 |
| Pivot points | S3 | S2 | S1 | PP | R1 | R2 | R3 |
|---|---|---|---|---|---|---|---|
| Standard | 3.216 | 3.588 | 3.865 | 4.237 | 4.514 | 4.886 | 5.163 |
| Camarilla | 3.964 | 4.023 | 4.083 | 4.142 | 4.202 | 4.261 | 4.321 |
| Woodie | 3.169 | 3.564 | 3.818 | 4.213 | 4.467 | 4.862 | 5.116 |
| Fibonacci | 3.588 | 3.836 | 3.989 | 4.237 | 4.485 | 4.638 | 4.886 |
Numerical data
The following is the status of the technical indicators and moving averages at the time of publication of this technical analysis:
| RSI (14): | 47.94 | |
| MACD (12,26,9): | -0.0150 | |
| Directional Movement: | -14.495 | |
| AROON (14): | -78.571 | |
| DEMA (21): | 3.675 | |
| Parabolic SAR (0,02-0,02-0,2): | 3.649 | |
| Elder Ray (13): | -0.006 | |
| Super Trend (3,10): | 3.734 | |
| Zig ZAG (10): | 3.690 | |
| VORTEX (21): | 0.8940 | |
| Stochastique (14,3,5): | 30.25 | |
| TEMA (21): | 3.672 | |
| Williams %R (14): | -49.41 | |
| Chande Momentum Oscillator (20): | -0.039 | |
| Repulse (5,40,3): | 0.9620 | |
| ROCnROLL: | -1 | |
| TRIX (15,9): | -0.0590 | |
| Courbe Coppock: | 1.42 |
| MA7: | 3.727 | |
| MA20: | 3.840 | |
| MA50: | 4.180 | |
| MA100: | 4.149 | |
| MAexp7: | 3.682 | |
| MAexp20: | 3.695 | |
| MAexp50: | 3.723 | |
| MAexp100: | 3.771 | |
| Price / MA7: | -0.67% | |
| Price / MA20: | -3.59% | |
| Price / MA50: | -11.44% | |
| Price / MA100: | -10.77% | |
| Price / MAexp7: | +0.54% | |
| Price / MAexp20: | +0.19% | |
| Price / MAexp50: | -0.56% | |
| Price / MAexp100: | -1.83% |
News
Don't forget to follow the news on EDP. At the time of publication of this analysis, the latest news was as follows:
- Kuva Systems, the leading Industrial IoT methane emission detection platform and Montrose Sensible EDP, a leader in revolutionizing the way environmental data is managed and monitored have collaborated to provide a comprehensive suite of environmental data technology
- Parade Technologies Announces World’s First Integrated Display eDP Timing Controller with Embedded Source Drivers and Touchscreen Controller for Notebook LTPS and Oxide In-Cell Panels
- EDP Partners with Vodafone Portugal and TechSee to Launch Visual Assistance for Customers and Field Technicians
- NIPSCO, EDP Renewables to Bring Indiana Crossroads II Wind Farm and Indiana Crossroads Solar Park to Northwest Indiana
- EdpFinance B.V. - Half Year Report 2020
About author
Online


Add a comment
Comments
0 comments on the analysis EDP - 1H