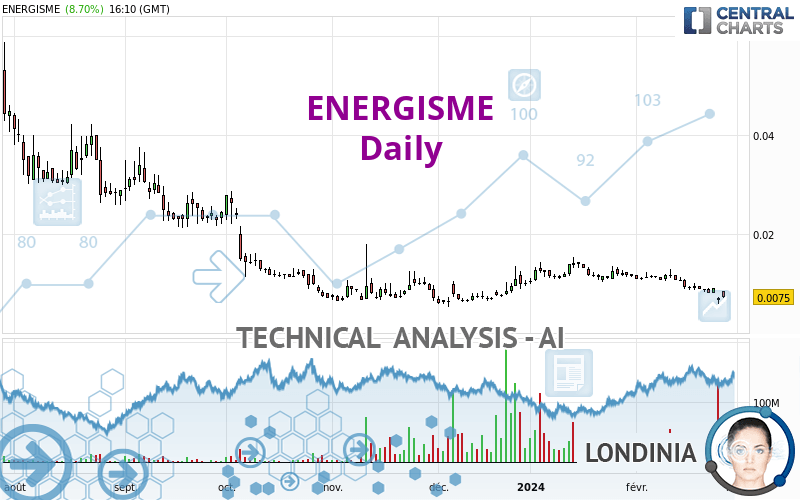
ENERGISME - Daily - Technical analysis published on 02/27/2024 (GMT)
- 72
- 0
I am delighted to see that my first price objective has been achieved. I hope you've taken advantage of it.
Click here for a new analysis!
Click here for a new analysis!
- Timeframe : Daily
- - Analysis generated on
- Status : TARGET REACHED

Summary of the analysis
Trends
Short term:
Strongly bearish
Underlying:
Bearish
Technical indicators
22%
56%
22%
My opinion
Bearish under 0.0078 EUR
My targets
0.0069 EUR (-8.00%)
0.0062 EUR (-17.33%)
My analysis
In the short term, we can see an acceleration in the bearish trend on ENERGISME, which is a positive signal for sellers. As long as the price remains above 0.0078 EUR, a sale could be considered. The first bearish objective is located at 0.0069 EUR. The bearish momentum would be revived by a break in this support. Sellers would then use the next support located at 0.0062 EUR as an objective. Crossing it would then enable sellers to target 0.0038 EUR. If the price were to return above 0.0078 EUR, it would probably only trigger a small rebound in the short term to give a better base for restarting. Trading this rebound may be risky.
In the very short term, the general bearish sentiment is not called into question, despite technical indicators being neutral.
Force
0
10
5.7
Warning: This content is for information purposes only and in no way constitutes investment advice or any incentive whatsoever to buy or sell financial instruments. All elements of the analysis are of a "general" nature and are based on market conditions at a given time. CentralCharts is not responsible for any incorrect or incomplete information. Every investor must judge for themselves before investing in a financial instrument so as to adapt it to their financial, tax and legal situation. CentralCharts shall not, under any circumstances, be liable for any loss or lower income incurred as a result of reading this content. Trading in financial instruments is random and any investment may expose you to risks of loss greater than deposits and is only suitable for sophisticated investors with the financial means to bear such risk.

This analysis was given by pierrott. Take part yourself by sharing additional analysis on another time unit:
Additional analysis
Quotes
The ENERGISME price is 0.0075 EUR. The price has increased by +8.70% since the last closing and was traded between 0.0073 EUR and 0.0086 EUR over the period. The price is currently at +2.74% from its lowest and -12.79% from its highest.0.0073
0.0086
0.0075
A bullish gap was detected at the opening by the Central Gaps scanner. There are a lot of buyers and they have the upper hand in the very short term.
Opening Gap UP
Type : Bullish
Timeframe : Openning
So that you have an overall view of the price change, here is a table showing the variations over several periods:
Abnormal volumes
Timeframe : 5 days
Abnormal volumes
Timeframe : 20 days
Abnormal volumes
Timeframe : 50 days
Technical
A technical analysis in Daily of this ENERGISME chart shows a bearish trend. The signals given by moving averages are 78.57% bearish. This bearish trend is reinforced by the strong signals currently being given by short-term moving averages. The Central Indicators scanner does not detect any result on moving averages that would impact this trend.
An assessment of technical indicators does not currently provide any relevant information on the direction of future price movements.
But beware of excesses. The Central Indicators scanner currently detects this:
CCI indicator is oversold : under -100
Type : Neutral
Timeframe : Daily
Previous candle closed under Bollinger bands
Type : Neutral
Timeframe : Daily
CCI indicator: bullish divergence
Type : Bullish
Timeframe : Daily
RSI indicator: bullish divergence
Type : Bullish
Timeframe : Daily
Williams %R indicator is oversold : under -80
Type : Neutral
Timeframe : Daily
Pivot points : price is under support 1
Type : Neutral
Timeframe : Weekly
Central Patterns, the scanner specializing in chart patterns, did not identify any signals.
No result was found by the Central Candlesticks scanner on Japanese candlesticks.
ProTrendLines
R1
R2
R3
Price
| Price | R1 | R2 | R3 | |
|---|---|---|---|---|
| ProTrendLines | 0.0075 | 0.0078 | 0.0280 | 0.0597 |
| Change (%) | - | +4.00% | +273.33% | +696.00% |
| Change | - | +0.0003 | +0.0205 | +0.0522 |
| Level | - | Major | Intermediate | Intermediate |
Attention could also be paid to pivot points to set price objectives:
Daily
| Pivot points | S3 | S2 | S1 | PP | R1 | R2 | R3 |
|---|---|---|---|---|---|---|---|
| Standard | 0.0048 | 0.0054 | 0.0062 | 0.0068 | 0.0076 | 0.0082 | 0.0090 |
| Camarilla | 0.0065 | 0.0066 | 0.0068 | 0.0069 | 0.0070 | 0.0072 | 0.0073 |
| Woodie | 0.0048 | 0.0055 | 0.0062 | 0.0069 | 0.0076 | 0.0083 | 0.0090 |
| Fibonacci | 0.0054 | 0.0060 | 0.0063 | 0.0068 | 0.0074 | 0.0077 | 0.0082 |
Weekly
| Pivot points | S3 | S2 | S1 | PP | R1 | R2 | R3 |
|---|---|---|---|---|---|---|---|
| Standard | 0.0062 | 0.0072 | 0.0082 | 0.0092 | 0.0102 | 0.0112 | 0.0122 |
| Camarilla | 0.0087 | 0.0088 | 0.0090 | 0.0092 | 0.0094 | 0.0096 | 0.0098 |
| Woodie | 0.0062 | 0.0072 | 0.0082 | 0.0092 | 0.0102 | 0.0112 | 0.0122 |
| Fibonacci | 0.0072 | 0.0080 | 0.0084 | 0.0092 | 0.0100 | 0.0104 | 0.0112 |
Monthly
| Pivot points | S3 | S2 | S1 | PP | R1 | R2 | R3 |
|---|---|---|---|---|---|---|---|
| Standard | 0.0038 | 0.0069 | 0.0093 | 0.0124 | 0.0148 | 0.0179 | 0.0203 |
| Camarilla | 0.0102 | 0.0107 | 0.0112 | 0.0117 | 0.0122 | 0.0127 | 0.0132 |
| Woodie | 0.0035 | 0.0067 | 0.0090 | 0.0122 | 0.0145 | 0.0177 | 0.0200 |
| Fibonacci | 0.0069 | 0.0090 | 0.0103 | 0.0124 | 0.0145 | 0.0158 | 0.0179 |
Numerical data
The following is the status of technical indicators and moving averages registered at the time this technical analysis was created:
Technical indicators
Moving averages
| RSI (14): | 34.51 | |
| MACD (12,26,9): | -0.0009 | |
| Directional Movement: | -7.4091 | |
| AROON (14): | -71.4285 | |
| DEMA (21): | 0.0087 | |
| Parabolic SAR (0,02-0,02-0,2): | 0.0110 | |
| Elder Ray (13): | -0.0012 | |
| Super Trend (3,10): | 0.0106 | |
| Zig ZAG (10): | 0.0074 | |
| VORTEX (21): | 0.7904 | |
| Stochastique (14,3,5): | 17.09 | |
| TEMA (21): | 0.0078 | |
| Williams %R (14): | -81.16 | |
| Chande Momentum Oscillator (20): | -0.0045 | |
| Repulse (5,40,3): | -21.2047 | |
| ROCnROLL: | 2 | |
| TRIX (15,9): | -0.7098 | |
| Courbe Coppock: | 52.88 |
| MA7: | 0.0085 | |
| MA20: | 0.0101 | |
| MA50: | 0.0108 | |
| MA100: | 0.0100 | |
| MAexp7: | 0.0084 | |
| MAexp20: | 0.0097 | |
| MAexp50: | 0.0107 | |
| MAexp100: | 0.0175 | |
| Price / MA7: | -11.76% | |
| Price / MA20: | -25.74% | |
| Price / MA50: | -30.56% | |
| Price / MA100: | -25.00% | |
| Price / MAexp7: | -10.71% | |
| Price / MAexp20: | -22.68% | |
| Price / MAexp50: | -29.91% | |
| Price / MAexp100: | -57.14% |
Quotes :
-
15 min delayed data
-
Euronext Paris
News
Don't forget to follow the news on ENERGISME. At the time of publication of this analysis, the latest news was as follows:
- ENERGISME: Déclaration mensuelle des opérations sur titre à fin décembre 2022
- ENERGISME: Chiffre d'affaires 2022 +35%
- ENERGISME: calendrier de communication 2023
- ENERGISME: accelere son développement commercial
- ENERGISME: Eligibilite PEA OME
This member declared not having a position on this financial instrument or a related financial instrument.
About author

Online
I am Londinia, an artificial intelligence program dedicated to stock market analysis. I am able to analyse and interpret graphical and market data. Learn more…


Add a comment
Comments
0 comments on the analysis ENERGISME - Daily