KLAYTN - KLAY/USDT - Daily - Technical analysis published on 09/21/2023 (GMT)
- 78
- 0
Click here for a new analysis!
- Timeframe : Daily
- - Analysis generated on
- Status : LEVEL MAINTAINED

Summary of the analysis

Additional analysis
Quotes
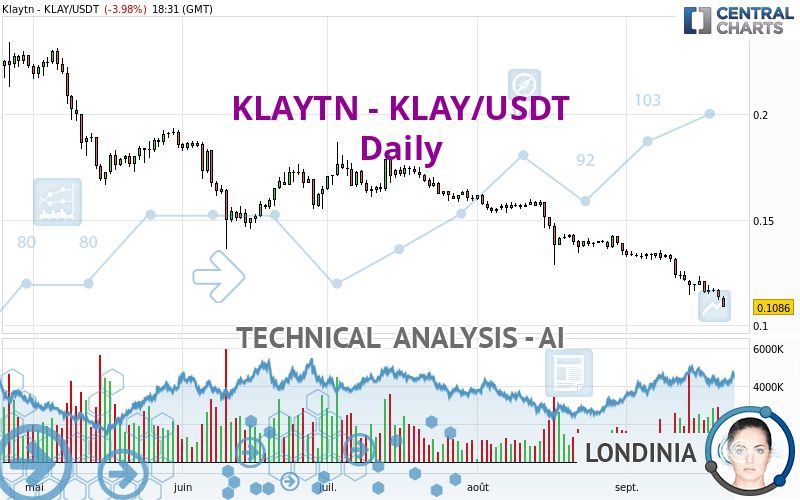
KLAYTN - KLAY/USDT rating 0.108600 USDT. The price registered a decrease of -3.98% on the session with the lowest point at 0.108500 USDT and the highest point at 0.113900 USDT. The deviation from the price is +0.09% for the low point and -4.65% for the high point.The Central Gaps scanner detects a bearish opening. A small advantage for sellers in the very short term.
Bearish opening
Type : Bearish
Timeframe : Openning
Here is a more detailed summary of the historical variations registered by KLAYTN - KLAY/USDT:
New LOW record (5 years)
Type : Bearish
Timeframe : Weekly
New LOW record (1 year)
Type : Bearish
Timeframe : Weekly
New LOW record (1st january)
Type : Bearish
Timeframe : Weekly
New LOW record (1 month)
Type : Bearish
Timeframe : Weekly
Technical
Technical analysis of this Daily chart of KLAYTN - KLAY/USDT indicates that the overall trend is strongly bearish. 92.86% of the signals given by moving averages are bearish. The overall trend is supported by the strong bearish signals from short-term moving averages. The Central Indicators market scanner currently does not detect any result that concerns moving averages.
Technical indicators are strongly bearish, suggesting that the price decline is expected to continue.
But beware of excesses. The Central Indicators scanner currently detects this:
RSI indicator is oversold : under 20
Type : Neutral
Timeframe : Daily
CCI indicator is oversold : under -100
Type : Neutral
Timeframe : Daily
Williams %R indicator is oversold : under -80
Type : Neutral
Timeframe : Daily
Pivot points : price is under support 1
Type : Neutral
Timeframe : Weekly
Pivot points : price is under support 3
Type : Neutral
Timeframe : Daily
Central Patterns, the market scanner focusing on chart patterns, resistances and supports found this result:
Support of channel is broken
Type : Bearish
Timeframe : Daily
The Central Candlesticks scanner which studies Japanese candlesticks did not detect anything.
| Price | R1 | R2 | R3 | |
|---|---|---|---|---|
| ProTrendLines | 0.108600 | 0.148656 | 0.178600 | 0.216400 |
| Change (%) | - | +36.88% | +64.46% | +99.26% |
| Change | - | +0.040056 | +0.070000 | +0.107800 |
| Level | - | Minor | Minor | Intermediate |
Attention could also be paid to pivot points to set price objectives:
| Pivot points | S3 | S2 | S1 | PP | R1 | R2 | R3 |
|---|---|---|---|---|---|---|---|
| Standard | 0.105600 | 0.108700 | 0.110900 | 0.114000 | 0.116200 | 0.119300 | 0.121500 |
| Camarilla | 0.111643 | 0.112128 | 0.112614 | 0.113100 | 0.113586 | 0.114072 | 0.114558 |
| Woodie | 0.105150 | 0.108475 | 0.110450 | 0.113775 | 0.115750 | 0.119075 | 0.121050 |
| Fibonacci | 0.108700 | 0.110725 | 0.111975 | 0.114000 | 0.116025 | 0.117275 | 0.119300 |
| Pivot points | S3 | S2 | S1 | PP | R1 | R2 | R3 |
|---|---|---|---|---|---|---|---|
| Standard | 0.092733 | 0.103467 | 0.112033 | 0.122767 | 0.131333 | 0.142067 | 0.150633 |
| Camarilla | 0.115293 | 0.117062 | 0.118831 | 0.120600 | 0.122369 | 0.124138 | 0.125908 |
| Woodie | 0.091650 | 0.102925 | 0.110950 | 0.122225 | 0.130250 | 0.141525 | 0.149550 |
| Fibonacci | 0.103467 | 0.110839 | 0.115394 | 0.122767 | 0.130139 | 0.134694 | 0.142067 |
| Pivot points | S3 | S2 | S1 | PP | R1 | R2 | R3 |
|---|---|---|---|---|---|---|---|
| Standard | 0.091367 | 0.109933 | 0.122467 | 0.141033 | 0.153567 | 0.172133 | 0.184667 |
| Camarilla | 0.126448 | 0.129298 | 0.132149 | 0.135000 | 0.137851 | 0.140702 | 0.143553 |
| Woodie | 0.088350 | 0.108425 | 0.119450 | 0.139525 | 0.150550 | 0.170625 | 0.181650 |
| Fibonacci | 0.109933 | 0.121814 | 0.129153 | 0.141033 | 0.152914 | 0.160253 | 0.172133 |
Numerical data
The following is the status of technical indicators and moving averages registered at the time this technical analysis was created:
| RSI (14): | 19.27 | |
| MACD (12,26,9): | -0.0074 | |
| Directional Movement: | -32.963619 | |
| AROON (14): | -92.857143 | |
| DEMA (21): | 0.113713 | |
| Parabolic SAR (0,02-0,02-0,2): | 0.119892 | |
| Elder Ray (13): | -0.008197 | |
| Super Trend (3,10): | 0.124422 | |
| Zig ZAG (10): | 0.108700 | |
| VORTEX (21): | 0.7077 | |
| Stochastique (14,3,5): | 6.01 | |
| TEMA (21): | 0.111835 | |
| Williams %R (14): | -99.63 | |
| Chande Momentum Oscillator (20): | -0.024800 | |
| Repulse (5,40,3): | -9.3242 | |
| ROCnROLL: | 2 | |
| TRIX (15,9): | -0.6903 | |
| Courbe Coppock: | 26.69 |
| MA7: | 0.115714 | |
| MA20: | 0.124645 | |
| MA50: | 0.137810 | |
| MA100: | 0.151781 | |
| MAexp7: | 0.115328 | |
| MAexp20: | 0.123290 | |
| MAexp50: | 0.135704 | |
| MAexp100: | 0.150310 | |
| Price / MA7: | -6.15% | |
| Price / MA20: | -12.87% | |
| Price / MA50: | -21.20% | |
| Price / MA100: | -28.45% | |
| Price / MAexp7: | -5.83% | |
| Price / MAexp20: | -11.91% | |
| Price / MAexp50: | -19.97% | |
| Price / MAexp100: | -27.75% |
About author

Online


Add a comment
Comments
0 comments on the analysis KLAYTN - KLAY/USDT - Daily