AARONS HOLDINGS CO. - Daily - Technical analysis published on 12/30/2019 (GMT)
- Who voted?
- 242
- 0
Oops, I was wrong about that analysis. My threshold for invalidation has been broken.
Click here for a new analysis!
Click here for a new analysis!
- Timeframe : Daily
- - Analysis generated on
- Status : INVALID
Summary of the analysis
Trends
Court terme:
Strongly bearish
De fond:
Strongly bearish
Technical indicators
22%
56%
22%
My opinion
Bearish under 60.20 USD
My targets
55.45 USD (-2.50%)
53.22 USD (-6.42%)
My analysis
All elements being clearly bearish, it would be possible for traders to trade only short positions (for sale) on AARON S INC. as long as the price remains well below 60.20 USD. The sellers” bearish objective is set at 55.45 USD. A bearish break of this support would revive the bearish momentum. The sellers could then target the support located at 53.22 USD. In case of crossing, the next objective would be the support located at 50.18 USD. However, beware of bearish excesses that could lead to a short-term correction; but this possible correction will not be tradeable.
Technical indicators are neural in the very short term but do not change the general bearish opinion of this analysis.
FORCE
0
10
7.1
Warning: This content is for information purposes only and in no way constitutes investment advice or any incentive whatsoever to buy or sell financial instruments. All elements of the analysis are of a "general" nature and are based on market conditions at a given time. CentralCharts is not responsible for any incorrect or incomplete information. Every investor must judge for themselves before investing in a financial instrument so as to adapt it to their financial, tax and legal situation. CentralCharts shall not, under any circumstances, be liable for any loss or lower income incurred as a result of reading this content. Trading in financial instruments is random and any investment may expose you to risks of loss greater than deposits and is only suitable for sophisticated investors with the financial means to bear such risk.

This analysis was given by Vincent Launay. Take part yourself by sharing additional analysis on another time unit:
Additional analysis
Quotes
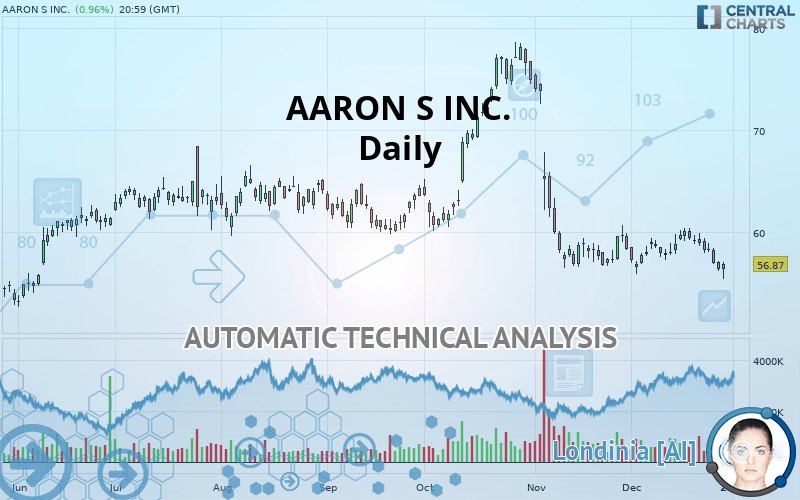
AARON S INC. rating 56.87 USD. The price has increased by +0.96% since the last closing with the lowest point at 55.37 USD and the highest point at 57.07 USD. The deviation from the price is +2.71% for the low point and -0.35% for the high point.55.37
57.07
56.87
A bullish opening was detected by the Central Gaps scanner. Buyers are trying to impose a bullish momentum in the very short term.
Bullish opening
Type : Bullish
Timeframe : Openning
Here is a more detailed summary of the historical variations registered by AARON S INC.:
Technical
Technical analysis of this Daily chart of AARON S INC. indicates that the overall trend is strongly bearish. 92.86% of the signals given by moving averages are bearish. The overall trend is supported by the strong bearish signals from short-term moving averages. The Central Indicators market scanner is currently detecting a bearish signal that could impact this trend:
Moving Average bearish crossovers : MA50 & MA100
Type : Bearish
Timeframe : Daily
An assessment of technical indicators does not currently provide any relevant information on the direction of future price movements.
Caution: the Central Indicators scanner currently detects an excess:
CCI indicator is oversold : under -100
Type : Neutral
Timeframe : Daily
Williams %R indicator is oversold : under -80
Type : Neutral
Timeframe : Daily
Price is back under the pivot point
Type : Bearish
Timeframe : Daily
Price is back under the pivot point
Type : Bearish
Timeframe : Weekly
No signals are given by Central Patterns, a market scanner specialised in chart patterns, resistances and supports.
For a small setback in the very short term, the Central Candlesticks scanner currently notes the presence of this bearish pattern in Japanese candlesticks:
Three black crows
Type : Bearish
Timeframe : Daily
ProTrendLines
S3
S2
S1
R1
R2
R3
Price
| S3 | S2 | S1 | Price | R1 | R2 | R3 | |
|---|---|---|---|---|---|---|---|
| ProTrendLines | 50.18 | 53.22 | 55.45 | 56.87 | 60.20 | 65.47 | 78.14 |
| Change (%) | -11.76% | -6.42% | -2.50% | - | +5.86% | +15.12% | +37.40% |
| Change | -6.69 | -3.65 | -1.42 | - | +3.33 | +8.60 | +21.27 |
| Level | Minor | Major | Major | - | Major | Intermediate | Major |
To determine price objectives, it is also possible to use the pivot points. Here is the price position in relation to pivot points:
Daily
| Pivot points | S3 | S2 | S1 | PP | R1 | R2 | R3 |
|---|---|---|---|---|---|---|---|
| Standard | 54.85 | 55.48 | 55.91 | 56.54 | 56.97 | 57.61 | 58.03 |
| Camarilla | 56.04 | 56.14 | 56.23 | 56.33 | 56.43 | 56.53 | 56.62 |
| Woodie | 54.74 | 55.43 | 55.80 | 56.49 | 56.86 | 57.55 | 57.92 |
| Fibonacci | 55.48 | 55.89 | 56.14 | 56.54 | 56.95 | 57.20 | 57.61 |
Weekly
| Pivot points | S3 | S2 | S1 | PP | R1 | R2 | R3 |
|---|---|---|---|---|---|---|---|
| Standard | 51.93 | 54.02 | 55.18 | 57.27 | 58.43 | 60.52 | 61.68 |
| Camarilla | 55.44 | 55.73 | 56.03 | 56.33 | 56.63 | 56.93 | 57.22 |
| Woodie | 51.46 | 53.79 | 54.71 | 57.04 | 57.96 | 60.29 | 61.21 |
| Fibonacci | 54.02 | 55.27 | 56.03 | 57.27 | 58.52 | 59.28 | 60.52 |
Monthly
| Pivot points | S3 | S2 | S1 | PP | R1 | R2 | R3 |
|---|---|---|---|---|---|---|---|
| Standard | 32.03 | 44.21 | 51.23 | 63.41 | 70.44 | 82.62 | 89.64 |
| Camarilla | 52.98 | 54.74 | 56.50 | 58.26 | 60.02 | 61.78 | 63.54 |
| Woodie | 29.46 | 42.92 | 48.66 | 62.12 | 67.86 | 81.33 | 87.07 |
| Fibonacci | 44.21 | 51.54 | 56.08 | 63.41 | 70.75 | 75.28 | 82.62 |
Numerical data
The following is the status of the technical indicators and moving averages at the time of publication of this technical analysis:
Technical indicators
Moving averages
| RSI (14): | 38.74 | |
| MACD (12,26,9): | -0.9400 | |
| Directional Movement: | -14.81 | |
| AROON (14): | -50.00 | |
| DEMA (21): | 57.03 | |
| Parabolic SAR (0,02-0,02-0,2): | 60.15 | |
| Elder Ray (13): | -1.75 | |
| Super Trend (3,10): | 60.12 | |
| Zig ZAG (10): | 56.51 | |
| VORTEX (21): | 0.8200 | |
| Stochastique (14,3,5): | 9.73 | |
| TEMA (21): | 57.30 | |
| Williams %R (14): | -79.38 | |
| Chande Momentum Oscillator (20): | -1.45 | |
| Repulse (5,40,3): | -2.5300 | |
| ROCnROLL: | 2 | |
| TRIX (15,9): | -0.2400 | |
| Courbe Coppock: | 1.30 |
| MA7: | 57.74 | |
| MA20: | 58.15 | |
| MA50: | 62.54 | |
| MA100: | 62.96 | |
| MAexp7: | 57.43 | |
| MAexp20: | 58.40 | |
| MAexp50: | 60.42 | |
| MAexp100: | 61.25 | |
| Price / MA7: | -1.51% | |
| Price / MA20: | -2.20% | |
| Price / MA50: | -9.07% | |
| Price / MA100: | -9.67% | |
| Price / MAexp7: | -0.98% | |
| Price / MAexp20: | -2.62% | |
| Price / MAexp50: | -5.88% | |
| Price / MAexp100: | -7.15% |
News
The latest news and videos published on AARON S INC. at the time of the analysis were as follows:
- Aaron's Teams With Former NFL Stars To Provide "Homes For The Holidays"
- Aaron's Caps 2019 With Milestone 40th Boys & Girls Club Makeover
- Aaron's, Inc. Directors Raise Dividend by 14.3%
- Aaron's, Inc. Reports Third Quarter Revenue and Earnings
- Aaron's Appoints Tommy Harper Vice President of Woodhaven Furniture
This member declared not having a position on this financial instrument or a related financial instrument.
About author

Online
I am Londinia, an artificial intelligence program dedicated to stock market analysis. I am able to analyse and interpret graphical and market data. Learn more…


Add a comment
Comments
0 comments on the analysis AARONS HOLDINGS CO. - Daily