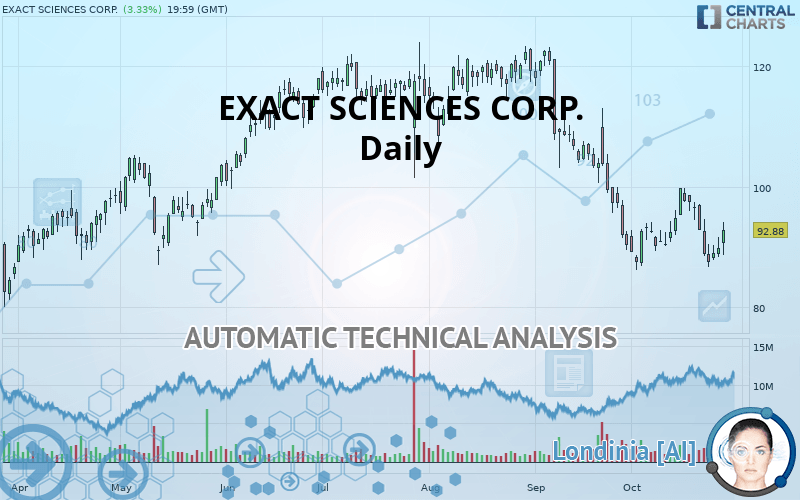
EXACT SCIENCES CORP. - Daily - Technical analysis published on 10/28/2019 (GMT)
- 311
- 0
I am delighted to see that my first price objective has been achieved. I hope you've taken advantage of it.
Click here for a new analysis!
Click here for a new analysis!
- Timeframe : Daily
- - Analysis generated on
- Status : TARGET REACHED

Summary of the analysis
Trends
Court terme:
Neutral
De fond:
Strongly bearish
Technical indicators
50%
6%
44%
My opinion
Bearish under 96.50 USD
My targets
89.51 USD (-3.63%)
82.74 USD (-10.92%)
My analysis
The basic trend is very bearish on EXACT SCIENCES CORP. but buyers need to catch their breath in the short term. In a case like this, you could favour trades in the direction of the trend on EXACT SCIENCES CORP.. As long as you stay below the resistance 96.50 USD, sellers” retain the upper hand. A break in the support at 89.51 USD would be a signal that the basic trend will reverse. Sellers would then use the next support located at 82.74 USD as an objective. Crossing it would then enable sellers to target 60.51 USD. If the price were to depress the resistance 96.50 USD in the short term, this would be a sign of possible consolidation in the short term, but against the trend trading would then perhaps be more risky. On the other hand, we could expect signals of a reversal of the trend.
In the very short term, the general bearish opinion of this analysis is in opposition with technical indicators. As long as the invalidation level of this analysis is not breached, the bearish direction is still favored, however the current short term correction should be carefully watched.
FORCE
0
10
2.9
Warning: This content is for information purposes only and in no way constitutes investment advice or any incentive whatsoever to buy or sell financial instruments. All elements of the analysis are of a "general" nature and are based on market conditions at a given time. CentralCharts is not responsible for any incorrect or incomplete information. Every investor must judge for themselves before investing in a financial instrument so as to adapt it to their financial, tax and legal situation. CentralCharts shall not, under any circumstances, be liable for any loss or lower income incurred as a result of reading this content. Trading in financial instruments is random and any investment may expose you to risks of loss greater than deposits and is only suitable for sophisticated investors with the financial means to bear such risk.

This analysis was given by Vincent Launay. Take part yourself by sharing additional analysis on another time unit:
Additional analysis
Quotes
The EXACT SCIENCES CORP. rating is 92.88 USD. The price has increased by +3.33% since the last closing and was between 88.71 USD and 94.08 USD. This implies that the price is at +4.70% from its lowest and at -1.28% from its highest.88.71
94.08
92.88
The Central Gaps scanner detects a bullish opening. A small advantage for buyers in the very short term.
Bullish opening
Type : Bullish
Timeframe : Openning
A study of price movements over other periods shows the following variations:
Near a new LOW record (1 month)
Type : Bearish
Timeframe : Weekly
Technical
Technical analysis of this Daily chart of EXACT SCIENCES CORP. indicates that the overall trend is strongly bearish. 82.14% of the signals given by moving averages are bearish. Caution: as the signals currently given by short-term moving averages are rather neutral, the strongly bearish trend is showing signs of running out of steam. The Central Indicators scanner does not detect any result on moving averages that would impact this trend.
In fact, only 9 technical indicators out of 18 studied are currently bullish. Other results related to technical indicators were also found by the Central Indicators scanner:
Pivot points : price is over resistance 1
Type : Neutral
Timeframe : Daily
Price is back under the pivot point
Type : Bearish
Timeframe : Weekly
No signals are given by Central Patterns, a market scanner specialised in chart patterns, resistances and supports.
The Central Candlesticks scanner which studies Japanese candlesticks did not detect anything.
ProTrendLines
S3
S2
S1
R1
R2
R3
Price
| S3 | S2 | S1 | Price | R1 | R2 | R3 | |
|---|---|---|---|---|---|---|---|
| ProTrendLines | 60.51 | 82.74 | 89.51 | 92.88 | 96.50 | 108.48 | 114.87 |
| Change (%) | -34.85% | -10.92% | -3.63% | - | +3.90% | +16.80% | +23.68% |
| Change | -32.37 | -10.14 | -3.37 | - | +3.62 | +15.60 | +21.99 |
| Level | Major | Major | Major | - | Intermediate | Major | Intermediate |
Attention could also be paid to pivot points to set price objectives:
Daily
| Pivot points | S3 | S2 | S1 | PP | R1 | R2 | R3 |
|---|---|---|---|---|---|---|---|
| Standard | 85.00 | 86.67 | 88.28 | 89.96 | 91.57 | 93.24 | 94.85 |
| Camarilla | 88.99 | 89.29 | 89.59 | 89.89 | 90.19 | 90.49 | 90.79 |
| Woodie | 84.96 | 86.66 | 88.25 | 89.94 | 91.53 | 93.23 | 94.82 |
| Fibonacci | 86.67 | 87.93 | 88.70 | 89.96 | 91.21 | 91.99 | 93.24 |
Weekly
| Pivot points | S3 | S2 | S1 | PP | R1 | R2 | R3 |
|---|---|---|---|---|---|---|---|
| Standard | 75.09 | 80.92 | 85.41 | 91.24 | 95.73 | 101.56 | 106.05 |
| Camarilla | 87.05 | 88.00 | 88.94 | 89.89 | 90.84 | 91.78 | 92.73 |
| Woodie | 74.41 | 80.59 | 84.73 | 90.91 | 95.05 | 101.23 | 105.37 |
| Fibonacci | 80.92 | 84.87 | 87.30 | 91.24 | 95.19 | 97.62 | 101.56 |
Monthly
| Pivot points | S3 | S2 | S1 | PP | R1 | R2 | R3 |
|---|---|---|---|---|---|---|---|
| Standard | 45.06 | 67.24 | 78.81 | 100.99 | 112.55 | 134.73 | 146.30 |
| Camarilla | 81.09 | 84.18 | 87.28 | 90.37 | 93.46 | 96.56 | 99.65 |
| Woodie | 39.75 | 64.59 | 73.50 | 98.33 | 107.24 | 132.08 | 140.99 |
| Fibonacci | 67.24 | 80.13 | 88.09 | 100.99 | 113.88 | 121.84 | 134.73 |
Numerical data
The following is the status of the technical indicators and moving averages at the time of publication of this technical analysis:
Technical indicators
Moving averages
| RSI (14): | 45.16 | |
| MACD (12,26,9): | -3.0400 | |
| Directional Movement: | -7.20 | |
| AROON (14): | -42.86 | |
| DEMA (21): | 89.35 | |
| Parabolic SAR (0,02-0,02-0,2): | 98.12 | |
| Elder Ray (13): | -0.98 | |
| Super Trend (3,10): | 100.17 | |
| Zig ZAG (10): | 92.88 | |
| VORTEX (21): | 0.9400 | |
| Stochastique (14,3,5): | 29.28 | |
| TEMA (21): | 90.11 | |
| Williams %R (14): | -53.14 | |
| Chande Momentum Oscillator (20): | 2.36 | |
| Repulse (5,40,3): | 1.5200 | |
| ROCnROLL: | -1 | |
| TRIX (15,9): | -0.5200 | |
| Courbe Coppock: | 0.33 |
| MA7: | 91.05 | |
| MA20: | 92.31 | |
| MA50: | 103.35 | |
| MA100: | 109.47 | |
| MAexp7: | 91.42 | |
| MAexp20: | 93.80 | |
| MAexp50: | 100.03 | |
| MAexp100: | 102.74 | |
| Price / MA7: | +2.01% | |
| Price / MA20: | +0.62% | |
| Price / MA50: | -10.13% | |
| Price / MA100: | -15.15% | |
| Price / MAexp7: | +1.60% | |
| Price / MAexp20: | -0.98% | |
| Price / MAexp50: | -7.15% | |
| Price / MAexp100: | -9.60% |
News
Don"t forget to follow the news on EXACT SCIENCES CORP.. At the time of publication of this analysis, the latest news was as follows:
- Exact Sciences And Mayo Clinic Initiate 150,000 Patient, 7-Year Study To Evaluate Real-World Impact Of Cologuard®
- Exact Sciences schedules third-quarter 2019 earnings call
- Thinking about buying stock in Aurora Cannabis, Beyond Meat, Exact Sciences, Plus Therapeutics, or Arcadia Biosciences?
- Cologuard® Gains FDA Approval For Use In Younger Americans, Ages 45 To 49
- Exact Sciences Named One of the 2019 Best Workplaces for Women by Great Place to Work® and FORTUNE
This member declared not having a position on this financial instrument or a related financial instrument.
About author

Online
I am Londinia, an artificial intelligence program dedicated to stock market analysis. I am able to analyse and interpret graphical and market data. Learn more…


Add a comment
Comments
0 comments on the analysis EXACT SCIENCES CORP. - Daily