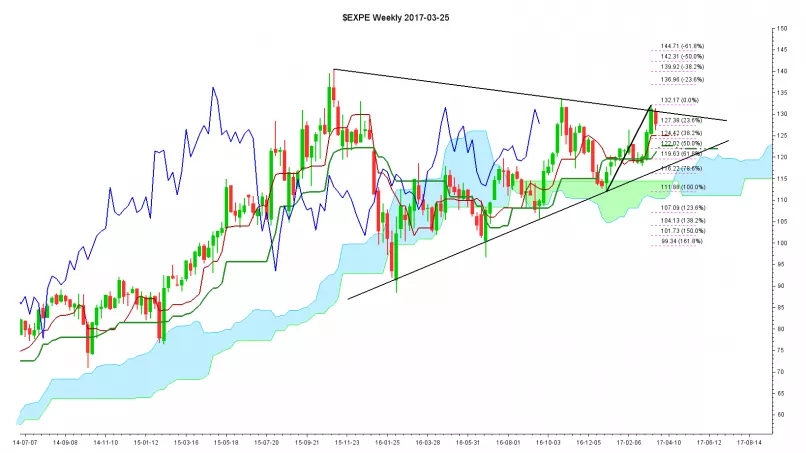
EXPEDIA GROUP INC. - Inside a symmetrical triangle the long-term trend is not clear #Ichimoku - 03/25/2017 (GMT)
- 952
- 0
- Who voted?
- Chart + One way trading
- Direction : Long/Short/Neutral
- |
- Long positions above : 132,17
- |
- Short positions below : 111,88
- |
- Neutral zone from : 111,88
- |
- Neutral zone up to : 132,17
- Timeframe : Weekly
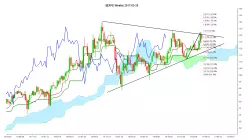
EXPEDIA GROUP INC. Chart
Are you looking for opportunities in American stocks?
DISCOVER LONDINIA OPPORTUNITIES...
DISCOVER LONDINIA OPPORTUNITIES...
Inside a symmetrical triangle that narrows it is possible to see the birth of a new trend in next weeks, above the last top the target 144 or below the last bottom the target 99.
This member did not declare if he had a position on this financial instrument or a related financial instrument.
About author

Offline


Add a comment
Comments
0 comments on the analysis EXPEDIA GROUP INC. - Weekly