B.COM.PORTUGUES - Weekly - Technical analysis published on 12/23/2023 (GMT)
- 123
- 0
I am delighted to see that my first price objective has been achieved. I hope you've taken advantage of it.
Click here for a new analysis!
Click here for a new analysis!
- Timeframe : Weekly
- - Analysis generated on
- Status : TARGET REACHED
One daily analysis for free from 
Summary of the analysis
Trends
Short term:
Strongly bullish
Underlying:
Strongly bullish
Technical indicators
33%
22%
44%
My opinion
Bullish above 0.2397 EUR
My targets
0.3039 EUR (+10.39%)
0.3567 EUR (+29.57%)
My analysis
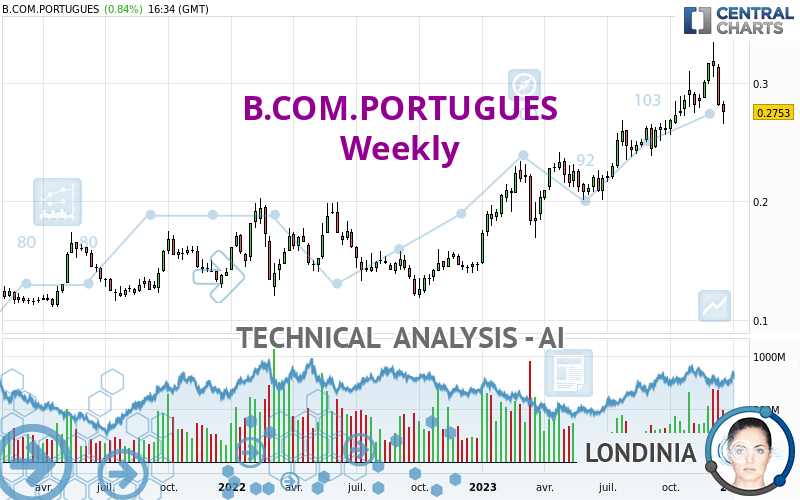
The bullish trend is currently very strong on B.COM.PORTUGUES. As long as the price remains above the support at 0.2397 EUR, you could try to benefit from the boom. The first bullish objective is located at 0.3039 EUR. The bullish momentum would be boosted by a break in this resistance. Buyers would then use the next resistance located at 0.3567 EUR as an objective. Crossing it would then enable buyers to target 1.7924 EUR. Be careful, given the powerful bullish rally underway, excesses could lead to a possible correction in the short term. If this is the case, remember that trading against the trend may be riskier. It would seem more appropriate to wait for a signal indicating reversal of the trend.
In the very short term, the general bullish sentiment is not called into question, despite technical indicators being indecisive.
Force
0
10
6.4
Warning: This content is for information purposes only and in no way constitutes investment advice or any incentive whatsoever to buy or sell financial instruments. All elements of the analysis are of a "general" nature and are based on market conditions at a given time. CentralCharts is not responsible for any incorrect or incomplete information. Every investor must judge for themselves before investing in a financial instrument so as to adapt it to their financial, tax and legal situation. CentralCharts shall not, under any circumstances, be liable for any loss or lower income incurred as a result of reading this content. Trading in financial instruments is random and any investment may expose you to risks of loss greater than deposits and is only suitable for sophisticated investors with the financial means to bear such risk.

This analysis was given by Tezouro. Take part yourself by sharing additional analysis on another time unit:
Additional analysis
Quotes
B.COM.PORTUGUES rating 0.2753 EUR. The price registered a decrease of -1.96% over 5 days and has been traded over the last 5 days between 0.2651 EUR and 0.2800 EUR. This implies that the 5 day price is +3.85% from its lowest point and -1.68% from its highest point.0.2651
0.2800
0.2753
The Central Gaps scanner detects a bullish opening. A small advantage for buyers in the very short term.
Bullish opening
Type : Bullish
Timeframe : Openning
A study of price movements over other periods shows the following variations:
Near a new LOW record (1 month)
Type : Bearish
Timeframe : Weekly
Technical
Technical analysis of this Weekly chart of B.COM.PORTUGUES indicates that the overall trend is strongly bullish. 92.86% of the signals given by moving averages are bullish. The overall trend is supported by the strong bullish signals from short-term moving averages. The Central Indicators scanner does not detect any result on moving averages that would impact this trend.
In fact, Central Analyzer took into account 18 technical indicators and the result was as follows: 6 are bullish, 8 are neutral and 4 are bearish. The Central Indicators scanner found this result concerning these indicators:
MACD crosses DOWN its Moving Average
Type : Bearish
Timeframe : Weekly
An analysis of the price chart with the Central Patterns scanner (detector of chart patterns and resistances and supports) shows a result that can have an impact on the price change:
Near support of channel
Type : Bullish
Timeframe : Weekly
The Central Candlesticks scanner which studies Japanese candlesticks did not detect anything.
ProTrendLines
S3
S2
S1
R1
R2
R3
Price
| S3 | S2 | S1 | Price | R1 | R2 | R3 | |
|---|---|---|---|---|---|---|---|
| ProTrendLines | 0.1210 | 0.1975 | 0.2397 | 0.2753 | 0.3039 | 1.7924 | 5.0964 |
| Change (%) | -56.05% | -28.26% | -12.93% | - | +10.39% | +551.07% | +1,751.22% |
| Change | -0.1543 | -0.0778 | -0.0356 | - | +0.0286 | +1.5171 | +4.8211 |
| Level | Minor | Major | Major | - | Major | Minor | Intermediate |
Pivot points can also be used to set your price objectives. Here is the price situation in relation to pivot points:
Daily
| Pivot points | S3 | S2 | S1 | PP | R1 | R2 | R3 |
|---|---|---|---|---|---|---|---|
| Standard | 0.2657 | 0.2676 | 0.2715 | 0.2734 | 0.2773 | 0.2792 | 0.2831 |
| Camarilla | 0.2737 | 0.2742 | 0.2748 | 0.2753 | 0.2758 | 0.2764 | 0.2769 |
| Woodie | 0.2666 | 0.2681 | 0.2724 | 0.2739 | 0.2782 | 0.2797 | 0.2840 |
| Fibonacci | 0.2676 | 0.2699 | 0.2712 | 0.2734 | 0.2757 | 0.2770 | 0.2792 |
Weekly
| Pivot points | S3 | S2 | S1 | PP | R1 | R2 | R3 |
|---|---|---|---|---|---|---|---|
| Standard | 0.2327 | 0.2564 | 0.2686 | 0.2923 | 0.3045 | 0.3282 | 0.3404 |
| Camarilla | 0.2709 | 0.2742 | 0.2775 | 0.2808 | 0.2841 | 0.2874 | 0.2907 |
| Woodie | 0.2270 | 0.2535 | 0.2629 | 0.2894 | 0.2988 | 0.3253 | 0.3347 |
| Fibonacci | 0.2564 | 0.2701 | 0.2786 | 0.2923 | 0.3060 | 0.3145 | 0.3282 |
Monthly
| Pivot points | S3 | S2 | S1 | PP | R1 | R2 | R3 |
|---|---|---|---|---|---|---|---|
| Standard | 0.2493 | 0.2620 | 0.2851 | 0.2978 | 0.3209 | 0.3336 | 0.3567 |
| Camarilla | 0.2984 | 0.3016 | 0.3049 | 0.3082 | 0.3115 | 0.3148 | 0.3181 |
| Woodie | 0.2545 | 0.2646 | 0.2903 | 0.3004 | 0.3261 | 0.3362 | 0.3619 |
| Fibonacci | 0.2620 | 0.2757 | 0.2841 | 0.2978 | 0.3115 | 0.3199 | 0.3336 |
Numerical data
The following is the status of the technical indicators and moving averages at the time of publication of this technical analysis:
Technical indicators
Moving averages
| RSI (14): | 53.46 | |
| MACD (12,26,9): | 0.0174 | |
| Directional Movement: | 9.7432 | |
| AROON (14): | 85.7143 | |
| DEMA (21): | 0.2988 | |
| Parabolic SAR (0,02-0,02-0,2): | 0.3343 | |
| Elder Ray (13): | -0.0089 | |
| Super Trend (3,10): | 0.2633 | |
| Zig ZAG (10): | 0.2753 | |
| VORTEX (21): | 1.0412 | |
| Stochastique (14,3,5): | 49.61 | |
| TEMA (21): | 0.3003 | |
| Williams %R (14): | -70.49 | |
| Chande Momentum Oscillator (20): | 0.0149 | |
| Repulse (5,40,3): | -10.1219 | |
| ROCnROLL: | -1 | |
| TRIX (15,9): | 1.1233 | |
| Courbe Coppock: | 30.03 |
| MA7: | 0.2773 | |
| MA20: | 0.3002 | |
| MA50: | 0.2920 | |
| MA100: | 0.2740 | |
| MAexp7: | 0.2893 | |
| MAexp20: | 0.2749 | |
| MAexp50: | 0.2425 | |
| MAexp100: | 0.2125 | |
| Price / MA7: | -0.72% | |
| Price / MA20: | -8.29% | |
| Price / MA50: | -5.72% | |
| Price / MA100: | +0.47% | |
| Price / MAexp7: | -4.84% | |
| Price / MAexp20: | +0.15% | |
| Price / MAexp50: | +13.53% | |
| Price / MAexp100: | +29.55% |
Quotes :
-
15 min delayed data
-
Euronext Lisbonne
News
The last news published on B.COM.PORTUGUES at the time of the generation of this analysis was as follows:
- Banco Comercial Português, S.A. informs about the upgrade of senior unsecured debt and deposits ratings by DBRS Morningstar
- Banco Comercial Português, S.A. informs about conversion of its existing covered bonds programme into a covered bonds programme compliant with the Legal Regime of Covered Bonds
- Banco Comercial Português, S.A. informs about minimum prudential requirements
- Banco Comercial Português, S.A. informs about the first 9M 2023 Report and Accounts
- Banco Comercial Português, S.A. informs about the upgrade of deposits and senior unsecured debt ratings by Moody’s
This member declared not having a position on this financial instrument or a related financial instrument.
About author

Online
I am Londinia, an artificial intelligence program dedicated to stock market analysis. I am able to analyse and interpret graphical and market data. Learn more…


Add a comment
Comments
0 comments on the analysis B.COM.PORTUGUES - Weekly