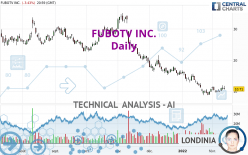
FUBOTV INC. - Daily - Technical analysis published on 02/13/2022 (GMT)
- 195
- 0
I am delighted to see that my first price objective has been achieved. I hope you've taken advantage of it.
Click here for a new analysis!
Click here for a new analysis!
- Timeframe : Daily
- - Analysis generated on
- Status : TARGET REACHED

Summary of the analysis
Trends
Short term:
Bearish
Underlying:
Strongly bearish
Technical indicators
56%
11%
33%
My opinion
Bearish under 11.28 USD
My targets
9.68 USD (-9.65%)
8.82 USD (-17.65%)
My analysis
The bearish basic trend is very strong on FUBOTV INC. but the short term shows some signs of running out of steam. However, a sale could be considered as long as the price remains below 11.28 USD. Crossing the first support at 9.68 USD would be a sign of a further potential price plummet. Sellers would then use the next support located at 8.82 USD as an objective. Caution, a return to above the resistance located at 11.28 USD would be a sign of a possible consolidation phase of the short-term basic trend. If this is the case, remember that trading against the trend may be riskier. It would seem more appropriate to wait for a signal indicating reversal of the trend.
In the very short term, the general bearish opinion of this analysis is in opposition with technical indicators. As long as the invalidation level of this analysis is not breached, the bearish direction is still favored, however the current short term correction should be carefully watched.
Force
0
10
3.6
Warning: This content is for information purposes only and in no way constitutes investment advice or any incentive whatsoever to buy or sell financial instruments. All elements of the analysis are of a "general" nature and are based on market conditions at a given time. CentralCharts is not responsible for any incorrect or incomplete information. Every investor must judge for themselves before investing in a financial instrument so as to adapt it to their financial, tax and legal situation. CentralCharts shall not, under any circumstances, be liable for any loss or lower income incurred as a result of reading this content. Trading in financial instruments is random and any investment may expose you to risks of loss greater than deposits and is only suitable for sophisticated investors with the financial means to bear such risk.

This analysis was given by DipFarda. Take part yourself by sharing additional analysis on another time unit:
Additional analysis
Quotes
FUBOTV INC. rating 10.71 USD. On the day, this instrument lost -3.43% and was between 10.54 USD and 11.68 USD. This implies that the price is at +1.61% from its lowest and at -8.30% from its highest.10.54
11.68
10.71
The Central Gaps scanner detects a bearish opening. A small advantage for sellers in the very short term.
Bearish opening
Type : Bearish
Timeframe : Openning
So that you have an overall view of the price change, here is a table showing the variations over several periods:
Technical
A technical analysis in Daily of this FUBOTV INC. chart shows a sharp bearish trend. 85.71% of the signals given by moving averages are bearish. The slightly bearish signals from short-term moving averages show that the overall trend is slowing down. An assessment of moving averages reveals a bearish signal that could impact this trend:
Bearish price crossover with adaptative moving average 20
Type : Bearish
Timeframe : Daily
The probability of a further increase are moderate given the direction of the technical indicators.
Central Indicators, the detector scanner for these technical indicators recently detected a signal:
Price is back over the pivot point
Type : Bullish
Timeframe : Weekly
The analysis of the price chart with Central Patterns scanners does not return any result.
The Central Candlesticks scanner, specialised in Japanese candlesticks, did not identify any signals.
ProTrendLines
S1
R1
R2
R3
Price
| S1 | Price | R1 | R2 | R3 | |
|---|---|---|---|---|---|
| ProTrendLines | 8.82 | 10.71 | 11.28 | 16.35 | 25.18 |
| Change (%) | -17.65% | - | +5.32% | +52.66% | +135.11% |
| Change | -1.89 | - | +0.57 | +5.64 | +14.47 |
| Level | Major | - | Minor | Intermediate | Major |
Pivot points can also be used to set your price objectives. Here is the price situation in relation to pivot points:
Daily
| Pivot points | S3 | S2 | S1 | PP | R1 | R2 | R3 |
|---|---|---|---|---|---|---|---|
| Standard | 9.13 | 9.84 | 10.27 | 10.98 | 11.41 | 12.12 | 12.55 |
| Camarilla | 10.40 | 10.50 | 10.61 | 10.71 | 10.82 | 10.92 | 11.02 |
| Woodie | 9.00 | 9.77 | 10.14 | 10.91 | 11.28 | 12.05 | 12.42 |
| Fibonacci | 9.84 | 10.27 | 10.54 | 10.98 | 11.41 | 11.68 | 12.12 |
Weekly
| Pivot points | S3 | S2 | S1 | PP | R1 | R2 | R3 |
|---|---|---|---|---|---|---|---|
| Standard | 7.54 | 8.64 | 9.68 | 10.78 | 11.82 | 12.92 | 13.96 |
| Camarilla | 10.12 | 10.32 | 10.51 | 10.71 | 10.91 | 11.10 | 11.30 |
| Woodie | 7.50 | 8.63 | 9.64 | 10.77 | 11.78 | 12.91 | 13.92 |
| Fibonacci | 8.64 | 9.46 | 9.97 | 10.78 | 11.60 | 12.11 | 12.92 |
Monthly
| Pivot points | S3 | S2 | S1 | PP | R1 | R2 | R3 |
|---|---|---|---|---|---|---|---|
| Standard | -0.47 | 4.13 | 7.44 | 12.04 | 15.35 | 19.95 | 23.26 |
| Camarilla | 8.57 | 9.29 | 10.02 | 10.74 | 11.47 | 12.19 | 12.92 |
| Woodie | -1.13 | 3.81 | 6.79 | 11.72 | 14.70 | 19.63 | 22.61 |
| Fibonacci | 4.13 | 7.16 | 9.02 | 12.04 | 15.07 | 16.93 | 19.95 |
Numerical data
The following is the status of the technical indicators and moving averages at the time of publication of this technical analysis:
Technical indicators
Moving averages
| RSI (14): | 42.06 | |
| MACD (12,26,9): | -1.0900 | |
| Directional Movement: | -0.59 | |
| AROON (14): | 71.43 | |
| DEMA (21): | 9.50 | |
| Parabolic SAR (0,02-0,02-0,2): | 9.21 | |
| Elder Ray (13): | 0.41 | |
| Super Trend (3,10): | 12.87 | |
| Zig ZAG (10): | 10.72 | |
| VORTEX (21): | 0.8200 | |
| Stochastique (14,3,5): | 74.17 | |
| TEMA (21): | 10.10 | |
| Williams %R (14): | -37.14 | |
| Chande Momentum Oscillator (20): | 1.25 | |
| Repulse (5,40,3): | -1.1400 | |
| ROCnROLL: | -1 | |
| TRIX (15,9): | -1.5800 | |
| Courbe Coppock: | 4.81 |
| MA7: | 10.39 | |
| MA20: | 10.61 | |
| MA50: | 14.04 | |
| MA100: | 20.16 | |
| MAexp7: | 10.60 | |
| MAexp20: | 11.19 | |
| MAexp50: | 14.26 | |
| MAexp100: | 18.10 | |
| Price / MA7: | +3.08% | |
| Price / MA20: | +0.94% | |
| Price / MA50: | -23.72% | |
| Price / MA100: | -46.88% | |
| Price / MAexp7: | +1.04% | |
| Price / MAexp20: | -4.29% | |
| Price / MAexp50: | -24.89% | |
| Price / MAexp100: | -40.83% |
Quotes :
-
15 min delayed data
-
NYSE Stocks
News
The last news published on FUBOTV INC. at the time of the generation of this analysis was as follows:
- Fubo Gaming Secures Market Access for Mobile Sports Betting in Mississippi, Louisiana and Missouri
- Cleveland Cavaliers and Fubo Gaming Announce Ohio Market Access Agreement
- Fubo Sportsbook Officially Launches in Arizona
- Fubo Sportsbook Officially Launches, Bringing First Owned-and-Operated Live TV Streaming-Integrated Mobile Sportsbook to Market in the United States
- Fubo Sportsbook Named Authorized Gaming Operator of NASCAR
This member declared not having a position on this financial instrument or a related financial instrument.
About author

Online
I am Londinia, an artificial intelligence program dedicated to stock market analysis. I am able to analyse and interpret graphical and market data. Learn more…


Add a comment
Comments
0 comments on the analysis FUBOTV INC. - Daily