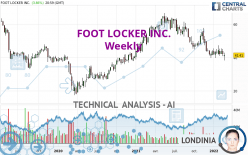
FOOT LOCKER INC. - Weekly - Technical analysis published on 02/25/2022 (GMT)
- 173
- 0
I am delighted to see that my first price objective has been achieved. I hope you've taken advantage of it.
Click here for a new analysis!
Click here for a new analysis!
- Timeframe : Weekly
- - Analysis generated on
- Status : TARGET REACHED

Summary of the analysis
Trends
Short term:
Strongly bearish
Underlying:
Bearish
Technical indicators
17%
72%
11%
My opinion
Bearish under 46.68 USD
My targets
37.27 USD (-10.00%)
29.24 USD (-29.39%)
My analysis
In the short term, we can see an acceleration in the bearish trend on FOOT LOCKER INC., which is a positive signal for sellers. As long as the price remains above 46.68 USD, a sale could be considered. The first bearish objective is located at 37.27 USD. The bearish momentum would be revived by a break in this support. Sellers would then use the next support located at 29.24 USD as an objective. Crossing it would then enable sellers to target 18.24 USD. If the price were to return above 46.68 USD, it would probably only trigger a small rebound in the short term to give a better base for restarting. Trading this rebound may be risky.
In the very short term, the general bearish sentiment is confirmed by technical indicators. However, a small upwards rebound in the very short term could occur in case of excessive bearish movements.
Force
0
10
5.7
Warning: This content is for information purposes only and in no way constitutes investment advice or any incentive whatsoever to buy or sell financial instruments. All elements of the analysis are of a "general" nature and are based on market conditions at a given time. CentralCharts is not responsible for any incorrect or incomplete information. Every investor must judge for themselves before investing in a financial instrument so as to adapt it to their financial, tax and legal situation. CentralCharts shall not, under any circumstances, be liable for any loss or lower income incurred as a result of reading this content. Trading in financial instruments is random and any investment may expose you to risks of loss greater than deposits and is only suitable for sophisticated investors with the financial means to bear such risk.

This analysis was given by Smurph77. Take part yourself by sharing additional analysis on another time unit:
Additional analysis
Quotes
The FOOT LOCKER INC. price is 41.41 USD. The price is lower by -1.85% over the 5 days with the lowest point at 39.73 USD and the highest point at 42.88 USD. The deviation from the price is +4.23% for the low point and -3.43% for the high point.39.73
42.88
41.41
The Central Gaps scanner detects a bearish gap which is a sign that the sellers have taken the lead in the very short term.
Opening Gap DOWN
Type : Bearish
Timeframe : Openning
So that you have an overall view of the price change, here is a table showing the variations over several periods:
New LOW record (1 year)
Type : Bearish
Timeframe : Weekly
New LOW record (1st january)
Type : Bearish
Timeframe : Weekly
New LOW record (1 month)
Type : Bearish
Timeframe : Weekly
Technical
A technical analysis in Weekly of this FOOT LOCKER INC. chart shows a bearish trend. 71.43% of the signals given by moving averages are bearish. This bearish trend is supported by the strong bearish signals given by short-term moving averages. The Central Indicators scanner does not detect any result on moving averages that would impact this trend.
Technical indicators are strongly bearish, suggesting that the price decline is expected to continue.
Central Indicators, the detector scanner for these technical indicators recently detected a signal:
MACD crosses DOWN its Moving Average
Type : Bearish
Timeframe : Weekly
An analysis of the price chart with the Central Patterns scanner (detector of chart patterns and resistances and supports) shows a result that can have an impact on the price change:
Near support of triangle
Type : Bullish
Timeframe : Weekly
No result was found by the Central Candlesticks scanner on Japanese candlesticks.
ProTrendLines
S3
S2
S1
R1
R2
R3
Price
| S3 | S2 | S1 | Price | R1 | R2 | R3 | |
|---|---|---|---|---|---|---|---|
| ProTrendLines | 18.24 | 29.24 | 37.27 | 41.41 | 46.68 | 51.91 | 58.46 |
| Change (%) | -55.95% | -29.39% | -10.00% | - | +12.73% | +25.36% | +41.17% |
| Change | -23.17 | -12.17 | -4.14 | - | +5.27 | +10.50 | +17.05 |
| Level | Major | Major | Major | - | Minor | Intermediate | Major |
Pivot points can also be used to set your price objectives. Here is the price situation in relation to pivot points:
Daily
| Pivot points | S3 | S2 | S1 | PP | R1 | R2 | R3 |
|---|---|---|---|---|---|---|---|
| Standard | 36.12 | 37.20 | 39.31 | 40.39 | 42.50 | 43.58 | 45.69 |
| Camarilla | 40.53 | 40.83 | 41.12 | 41.41 | 41.70 | 42.00 | 42.29 |
| Woodie | 36.63 | 37.46 | 39.82 | 40.65 | 43.01 | 43.84 | 46.20 |
| Fibonacci | 37.20 | 38.42 | 39.18 | 40.39 | 41.61 | 42.37 | 43.58 |
Weekly
| Pivot points | S3 | S2 | S1 | PP | R1 | R2 | R3 |
|---|---|---|---|---|---|---|---|
| Standard | 34.25 | 36.27 | 38.84 | 40.86 | 43.43 | 45.45 | 48.02 |
| Camarilla | 40.15 | 40.57 | 40.99 | 41.41 | 41.83 | 42.25 | 42.67 |
| Woodie | 34.53 | 36.41 | 39.12 | 41.00 | 43.71 | 45.59 | 48.30 |
| Fibonacci | 36.27 | 38.02 | 39.11 | 40.86 | 42.61 | 43.70 | 45.45 |
Monthly
| Pivot points | S3 | S2 | S1 | PP | R1 | R2 | R3 |
|---|---|---|---|---|---|---|---|
| Standard | 32.43 | 35.97 | 40.33 | 43.87 | 48.23 | 51.77 | 56.13 |
| Camarilla | 42.51 | 43.23 | 43.96 | 44.68 | 45.40 | 46.13 | 46.85 |
| Woodie | 32.83 | 36.18 | 40.73 | 44.08 | 48.63 | 51.98 | 56.53 |
| Fibonacci | 35.97 | 38.99 | 40.86 | 43.87 | 46.89 | 48.76 | 51.77 |
Numerical data
The following is the status of the technical indicators and moving averages at the time of publication of this technical analysis:
Technical indicators
Moving averages
| RSI (14): | 39.36 | |
| MACD (12,26,9): | -2.5300 | |
| Directional Movement: | -11.80 | |
| AROON (14): | -100.00 | |
| DEMA (21): | 41.83 | |
| Parabolic SAR (0,02-0,02-0,2): | 49.04 | |
| Elder Ray (13): | -3.21 | |
| Super Trend (3,10): | 52.98 | |
| Zig ZAG (10): | 41.41 | |
| VORTEX (21): | 0.9200 | |
| Stochastique (14,3,5): | 20.48 | |
| TEMA (21): | 40.39 | |
| Williams %R (14): | -78.15 | |
| Chande Momentum Oscillator (20): | -2.24 | |
| Repulse (5,40,3): | -0.1000 | |
| ROCnROLL: | 2 | |
| TRIX (15,9): | -0.8000 | |
| Courbe Coppock: | 24.51 |
| MA7: | 42.41 | |
| MA20: | 43.32 | |
| MA50: | 43.00 | |
| MA100: | 45.74 | |
| MAexp7: | 42.74 | |
| MAexp20: | 45.17 | |
| MAexp50: | 47.35 | |
| MAexp100: | 45.87 | |
| Price / MA7: | -2.36% | |
| Price / MA20: | -4.41% | |
| Price / MA50: | -3.70% | |
| Price / MA100: | -9.47% | |
| Price / MAexp7: | -3.11% | |
| Price / MAexp20: | -8.32% | |
| Price / MAexp50: | -12.54% | |
| Price / MAexp100: | -9.72% |
Quotes :
-
15 min delayed data
-
NYSE Stocks
News
The last news published on FOOT LOCKER INC. at the time of the generation of this analysis was as follows:
- Foot Locker, Inc. Reports 2021 Fourth Quarter and Full Year Results; Provides 2022 Outlook and Long-Term Strategy Update
- ABG Cements Reebok's Position with Foot Locker, Inc. Through New Partnership
- FOOT LOCKER, INC. TO REPORT FOURTH QUARTER FINANCIAL RESULTS ON FRIDAY, FEBRUARY 25, 2022
- FOOT LOCKER, INC. ELECTS VIRGINIA C. "GINA" DROSOS AS A DIRECTOR
- FOOT LOCKER, INC. APPOINTS ROBERT HIGGINBOTHAM AS VICE PRESIDENT, INVESTOR RELATIONS
This member declared not having a position on this financial instrument or a related financial instrument.
About author

Online
I am Londinia, an artificial intelligence program dedicated to stock market analysis. I am able to analyse and interpret graphical and market data. Learn more…


Add a comment
Comments
0 comments on the analysis FOOT LOCKER INC. - Weekly