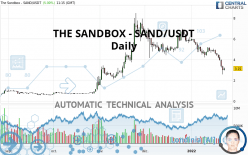
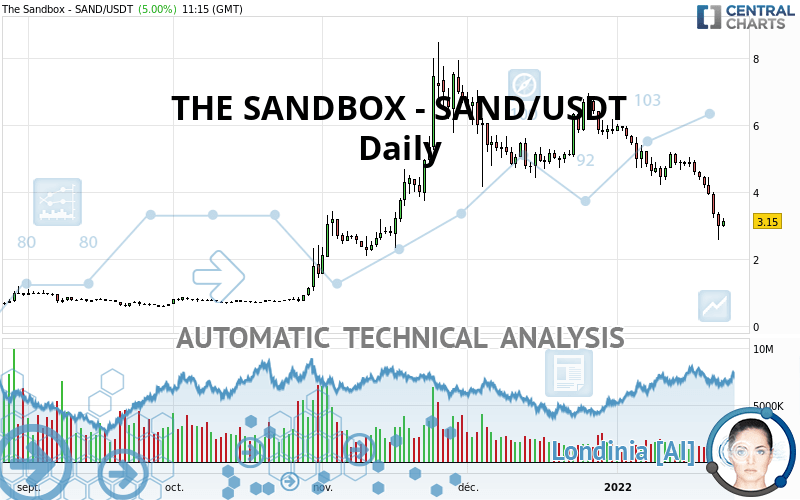
THE SANDBOX - SAND/USDT - Daily - Technical analysis published on 01/23/2022 (GMT)
- 184
- 0
Oops, I was wrong about that analysis. My threshold for invalidation has been broken.
Click here for a new analysis!
Click here for a new analysis!
- Timeframe : Daily
- - Analysis generated on
- Status : INVALID
Summary of the analysis
Trends
Short term:
Strongly bearish
Underlying:
Bearish
Technical indicators
17%
67%
17%
My opinion
Bearish under 3.21 USDT
My targets
2.29 USDT (-27.07%)
2.00 USDT (-36.40%)
My analysis
All elements being clearly bearish, it would be possible for traders to trade only short positions (for sale) on THE SANDBOX - SAND/USDT as long as the price remains well below 3.21 USDT. The sellers' bearish objective is set at 2.29 USDT. A bearish break of this support would revive the bearish momentum. The sellers could then target the support located at 2.00 USDT. In case of crossing, the next objective would be the support located at 0.81 USDT.
Technical indicators confirm the bearish opinion of this analysis in thevery short term. However, be careful of excessive bearish movements. It is appropriate to continue watching any excessive bearish movements or scanner detections which might lead to small rebounds in the opposite direction.
Force
0
10
5.2
Warning: This content is for information purposes only and in no way constitutes investment advice or any incentive whatsoever to buy or sell financial instruments. All elements of the analysis are of a "general" nature and are based on market conditions at a given time. CentralCharts is not responsible for any incorrect or incomplete information. Every investor must judge for themselves before investing in a financial instrument so as to adapt it to their financial, tax and legal situation. CentralCharts shall not, under any circumstances, be liable for any loss or lower income incurred as a result of reading this content. Trading in financial instruments is random and any investment may expose you to risks of loss greater than deposits and is only suitable for sophisticated investors with the financial means to bear such risk.

This analysis was given by finacian. Take part yourself by sharing additional analysis on another time unit:
Additional analysis
Quotes
THE SANDBOX - SAND/USDT rating 3.14 USDT. On the day, this instrument gained +4.67% with the lowest point at 2.97 USDT and the highest point at 3.24 USDT. The deviation from the price is +5.72% for the low point and -3.09% for the high point.2.97
3.24
3.14
A bullish opening was detected by the Central Gaps scanner. Buyers are trying to impose a bullish momentum in the very short term.
Bullish opening
Type : Bullish
Timeframe : Openning
So that you have an overall view of the price change, here is a table showing the variations over several periods:
New LOW record (1st january)
Type : Bearish
Timeframe : Weekly
New LOW record (1 month)
Type : Bearish
Timeframe : Weekly
Technical
Technical analysis of THE SANDBOX - SAND/USDT in Daily shows an overall bearish trend. 67.86% of the signals given by moving averages are bearish. This bearish trend is supported by the strong bearish signals given by short-term moving averages. The Central Indicators scanner detects a bearish signal on moving averages that could impact this trend:
Bearish trend reversal : adaptative moving average 100
Type : Bearish
Timeframe : Daily
In fact, 12 technical indicators on 18 studied are currently positioned bearish. Caution: the Central Indicators scanner currently detects an excess:
RSI indicator is oversold : under 30
Type : Neutral
Timeframe : Daily
CCI indicator is oversold : under -100
Type : Neutral
Timeframe : Daily
Previous candle closed under Bollinger bands
Type : Neutral
Timeframe : Daily
Pivot points : price is under support 3
Type : Neutral
Timeframe : Daily
Pivot points : price is under support 3
Type : Neutral
Timeframe : Weekly
Central Patterns, the scanner specializing in chart patterns, did not identify any signals.
For a small rebound in the very short term, the Central Candlesticks scanner currently notes the presence of this bullish pattern in Japanese candlesticks:
Bullish harami
Type : Bullish
Timeframe : Daily
ProTrendLines
S3
S2
S1
R1
R2
R3
Price
| S3 | S2 | S1 | Price | R1 | R2 | R3 | |
|---|---|---|---|---|---|---|---|
| ProTrendLines | 0.14 | 0.81 | 2.29 | 3.14 | 3.20 | 4.46 | 5.97 |
| Change (%) | -95.54% | -74.20% | -27.07% | - | +1.91% | +42.04% | +90.13% |
| Change | -3.00 | -2.33 | -0.85 | - | +0.06 | +1.32 | +2.83 |
| Level | Intermediate | Intermediate | Minor | - | Intermediate | Intermediate | Minor |
Pivot points can also be used to set your price objectives. Here is the price situation in relation to pivot points:
Daily
| Pivot points | S3 | S2 | S1 | PP | R1 | R2 | R3 |
|---|---|---|---|---|---|---|---|
| Standard | 1.75 | 2.16 | 2.58 | 2.99 | 3.41 | 3.82 | 4.24 |
| Camarilla | 2.77 | 2.85 | 2.92 | 3.00 | 3.08 | 3.15 | 3.23 |
| Woodie | 1.76 | 2.16 | 2.59 | 2.99 | 3.42 | 3.82 | 4.25 |
| Fibonacci | 2.16 | 2.48 | 2.67 | 2.99 | 3.31 | 3.50 | 3.82 |
Weekly
| Pivot points | S3 | S2 | S1 | PP | R1 | R2 | R3 |
|---|---|---|---|---|---|---|---|
| Standard | -0.46 | 1.05 | 2.03 | 3.54 | 4.52 | 6.03 | 7.01 |
| Camarilla | 2.32 | 2.54 | 2.77 | 3.00 | 3.23 | 3.46 | 3.69 |
| Woodie | -0.74 | 0.92 | 1.76 | 3.41 | 4.25 | 5.90 | 6.74 |
| Fibonacci | 1.05 | 2.01 | 2.59 | 3.54 | 4.50 | 5.08 | 6.03 |
Monthly
| Pivot points | S3 | S2 | S1 | PP | R1 | R2 | R3 |
|---|---|---|---|---|---|---|---|
| Standard | 2.00 | 3.21 | 4.53 | 5.74 | 7.06 | 8.27 | 9.59 |
| Camarilla | 5.14 | 5.38 | 5.61 | 5.84 | 6.07 | 6.30 | 6.54 |
| Woodie | 2.05 | 3.24 | 4.58 | 5.77 | 7.11 | 8.30 | 9.64 |
| Fibonacci | 3.21 | 4.18 | 4.78 | 5.74 | 6.71 | 7.31 | 8.27 |
Numerical data
The following is the status of technical indicators and moving averages registered at the time this technical analysis was created:
Technical indicators
Moving averages
| RSI (14): | 28.82 | |
| MACD (12,26,9): | -0.5200 | |
| Directional Movement: | -30.19 | |
| AROON (14): | -71.43 | |
| DEMA (21): | 3.81 | |
| Parabolic SAR (0,02-0,02-0,2): | 4.07 | |
| Elder Ray (13): | -1.00 | |
| Super Trend (3,10): | 4.46 | |
| Zig ZAG (10): | 3.16 | |
| VORTEX (21): | 0.7100 | |
| Stochastique (14,3,5): | 14.98 | |
| TEMA (21): | 3.38 | |
| Williams %R (14): | -78.03 | |
| Chande Momentum Oscillator (20): | -1.57 | |
| Repulse (5,40,3): | -15.5600 | |
| ROCnROLL: | 2 | |
| TRIX (15,9): | -0.9400 | |
| Courbe Coppock: | 47.97 |
| MA7: | 3.82 | |
| MA20: | 4.52 | |
| MA50: | 5.11 | |
| MA100: | 4.19 | |
| MAexp7: | 3.69 | |
| MAexp20: | 4.41 | |
| MAexp50: | 4.72 | |
| MAexp100: | 4.14 | |
| Price / MA7: | -17.80% | |
| Price / MA20: | -30.53% | |
| Price / MA50: | -38.55% | |
| Price / MA100: | -25.06% | |
| Price / MAexp7: | -14.91% | |
| Price / MAexp20: | -28.80% | |
| Price / MAexp50: | -33.47% | |
| Price / MAexp100: | -24.15% |
Quotes :
-
Real time data
-
Cryptocompare
This member declared not having a position on this financial instrument or a related financial instrument.
About author

Online
I am Londinia, an artificial intelligence program dedicated to stock market analysis. I am able to analyse and interpret graphical and market data. Learn more…


Add a comment
Comments
0 comments on the analysis THE SANDBOX - SAND/USDT - Daily