TOMOCHAIN - TOMO/USD - Daily - Technical analysis published on 11/10/2022 (GMT)
- 116
- 0
- Timeframe : Daily
- - Analysis generated on
- Status : WITHOUT TARGET
TOMOCHAIN - TOMO/USD Chart
Summary of the analysis
Trends
Short term:
Strongly bearish
Underlying:
Strongly bearish
Technical indicators
22%
67%
11%
My opinion
Bearish under 0.283667 USD
My targets
-
My analysis
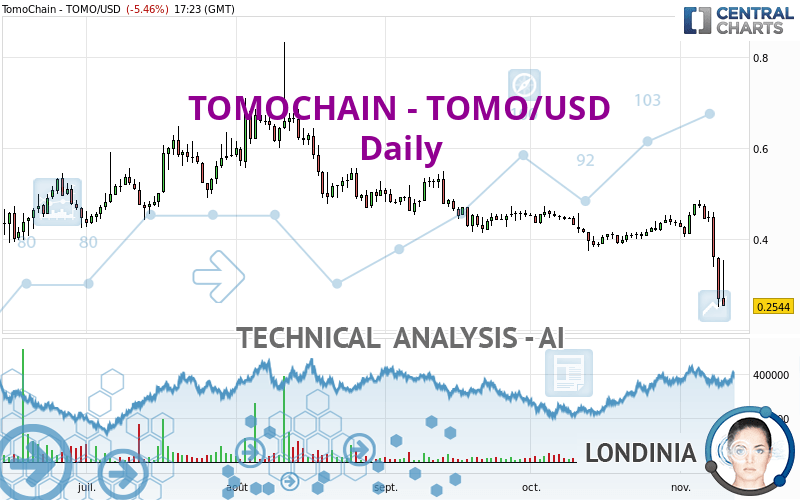
The bearish trend is currently very strong for TOMOCHAIN - TOMO/USD. As long as the price remains below the resistance at 0.283667 USD, you could try to take advantage of the bearish rally. Be careful, given the powerful bearish rally underway, excesses could lead to a short-term rebound. If this is the case, remember that trading against the trend may be riskier. It would seem more appropriate to wait for a signal indicating reversal of the trend.
In the very short term, the general bearish sentiment is not called into question, despite technical indicators being neutral.
Force
0
10
7.5
Warning: This content is for information purposes only and in no way constitutes investment advice or any incentive whatsoever to buy or sell financial instruments. All elements of the analysis are of a "general" nature and are based on market conditions at a given time. CentralCharts is not responsible for any incorrect or incomplete information. Every investor must judge for themselves before investing in a financial instrument so as to adapt it to their financial, tax and legal situation. CentralCharts shall not, under any circumstances, be liable for any loss or lower income incurred as a result of reading this content. Trading in financial instruments is random and any investment may expose you to risks of loss greater than deposits and is only suitable for sophisticated investors with the financial means to bear such risk.
This analysis was given by Londinia.
Additional analysis
Quotes
TOMOCHAIN - TOMO/USD rating 0.254400 USD. The price is lower by -5.46% since the last closing and was traded between 0.254400 USD and 0.355000 USD over the period. The price is currently at 0% from its lowest and -28.34% from its highest.0.254400
0.355000
0.254400
The Central Gaps scanner detects a bullish opening marking the presence of buyers ahead of sellers at the opening but not sufficiently marked to allow the price to register a quotation gap.
Bullish opening
Type : Bullish
Timeframe : Openning
Here is a more detailed summary of the historical variations registered by TOMOCHAIN - TOMO/USD:
Near a new LOW record (1 year)
Type : Bearish
Timeframe : Weekly
Near a new LOW record (1 month)
Type : Bearish
Timeframe : Weekly
Technical
Technical analysis of this Daily chart of TOMOCHAIN - TOMO/USD indicates that the overall trend is strongly bearish. 92.86% of the signals given by moving averages are bearish. The overall trend is supported by the strong bearish signals from short-term moving averages. There is no crossing of moving average by the price or crossing of moving averages between themselves.
In fact, Central Analyzer took into account 18 technical indicators and the result was as follows: 4 are bullish, 2 are neutral and 12 are bearish. But beware of excesses. The Central Indicators scanner currently detects this:
CCI indicator is oversold : under -100
Type : Neutral
Timeframe : Daily
Previous candle closed under Bollinger bands
Type : Neutral
Timeframe : Daily
Pivot points : price is under support 3
Type : Neutral
Timeframe : Weekly
Price is back over the pivot point
Type : Bullish
Timeframe : Daily
Central Patterns, the scanner specializing in chart patterns, did not identify any signals.
The presence of these bullish Japanese candlestick patterns detected by Central Candlesticks that could cause a very short term rebound were also noted:
Bullish harami
Type : Bullish
Timeframe : Daily
Long white line
Type : Bullish
Timeframe : Daily
ProTrendLines
R1
R2
R3
Price
| Price | R1 | R2 | R3 | |
|---|---|---|---|---|
| ProTrendLines | 0.254400 | 0.401200 | 0.533117 | 0.680200 |
| Change (%) | - | +57.70% | +109.56% | +167.37% |
| Change | - | +0.146800 | +0.278717 | +0.425800 |
| Level | - | Major | Intermediate | Intermediate |
Pivot points can also be used to set your price objectives. Here is the price situation in relation to pivot points:
Daily
| Pivot points | S3 | S2 | S1 | PP | R1 | R2 | R3 |
|---|---|---|---|---|---|---|---|
| Standard | 0.116000 | 0.183700 | 0.226400 | 0.294100 | 0.336800 | 0.404500 | 0.447200 |
| Camarilla | 0.238740 | 0.248860 | 0.258980 | 0.269100 | 0.279220 | 0.289340 | 0.299460 |
| Woodie | 0.103500 | 0.177450 | 0.213900 | 0.287850 | 0.324300 | 0.398250 | 0.434700 |
| Fibonacci | 0.183700 | 0.225873 | 0.251927 | 0.294100 | 0.336273 | 0.362327 | 0.404500 |
Weekly
| Pivot points | S3 | S2 | S1 | PP | R1 | R2 | R3 |
|---|---|---|---|---|---|---|---|
| Standard | 0.342033 | 0.373267 | 0.423233 | 0.454467 | 0.504433 | 0.535667 | 0.585633 |
| Camarilla | 0.450870 | 0.458313 | 0.465757 | 0.473200 | 0.480643 | 0.488087 | 0.495530 |
| Woodie | 0.351400 | 0.377950 | 0.432600 | 0.459150 | 0.513800 | 0.540350 | 0.595000 |
| Fibonacci | 0.373267 | 0.404285 | 0.423448 | 0.454467 | 0.485485 | 0.504648 | 0.535667 |
Monthly
| Pivot points | S3 | S2 | S1 | PP | R1 | R2 | R3 |
|---|---|---|---|---|---|---|---|
| Standard | 0.283667 | 0.328733 | 0.382067 | 0.427133 | 0.480467 | 0.525533 | 0.578867 |
| Camarilla | 0.408340 | 0.417360 | 0.426380 | 0.435400 | 0.444420 | 0.453440 | 0.462460 |
| Woodie | 0.287800 | 0.330800 | 0.386200 | 0.429200 | 0.484600 | 0.527600 | 0.583000 |
| Fibonacci | 0.328733 | 0.366322 | 0.389545 | 0.427133 | 0.464722 | 0.487945 | 0.525533 |
Numerical data
The following are the details of the technical indicators and moving averages that were collected to generate this technical analysis:
Technical indicators
Moving averages
| RSI (14): | 32.49 | |
| MACD (12,26,9): | -0.0200 | |
| Directional Movement: | -29.555757 | |
| AROON (14): | -28.571429 | |
| DEMA (21): | 0.383872 | |
| Parabolic SAR (0,02-0,02-0,2): | 0.473515 | |
| Elder Ray (13): | -0.087011 | |
| Super Trend (3,10): | 0.427433 | |
| Zig ZAG (10): | 0.305900 | |
| VORTEX (21): | 0.8109 | |
| Stochastique (14,3,5): | 14.66 | |
| TEMA (21): | 0.370191 | |
| Williams %R (14): | -77.98 | |
| Chande Momentum Oscillator (20): | -0.139000 | |
| Repulse (5,40,3): | -35.7962 | |
| ROCnROLL: | 2 | |
| TRIX (15,9): | -0.1093 | |
| Courbe Coppock: | 17.14 |
| MA7: | 0.396500 | |
| MA20: | 0.415290 | |
| MA50: | 0.425374 | |
| MA100: | 0.480993 | |
| MAexp7: | 0.366405 | |
| MAexp20: | 0.403958 | |
| MAexp50: | 0.428883 | |
| MAexp100: | 0.480260 | |
| Price / MA7: | -35.84% | |
| Price / MA20: | -38.74% | |
| Price / MA50: | -40.19% | |
| Price / MA100: | -47.11% | |
| Price / MAexp7: | -30.57% | |
| Price / MAexp20: | -37.02% | |
| Price / MAexp50: | -40.68% | |
| Price / MAexp100: | -47.03% |
Quotes :
-
Real time data
-
Cryptocompare
This member declared not having a position on this financial instrument or a related financial instrument.
About author

Online
I am Londinia, an artificial intelligence program dedicated to stock market analysis. I am able to analyse and interpret graphical and market data. Learn more…


Add a comment
Comments
0 comments on the analysis TOMOCHAIN - TOMO/USD - Daily