SIEMENS GAMESA - Daily - Technical analysis published on 09/19/2022 (GMT)
- 149
- 0
I am pleased to note that the threshold for invalidation has been maintained for 20 Candlesticks.
Click here for a new analysis!
Click here for a new analysis!
- Timeframe : Daily
- - Analysis generated on
- Status : LEVEL MAINTAINED

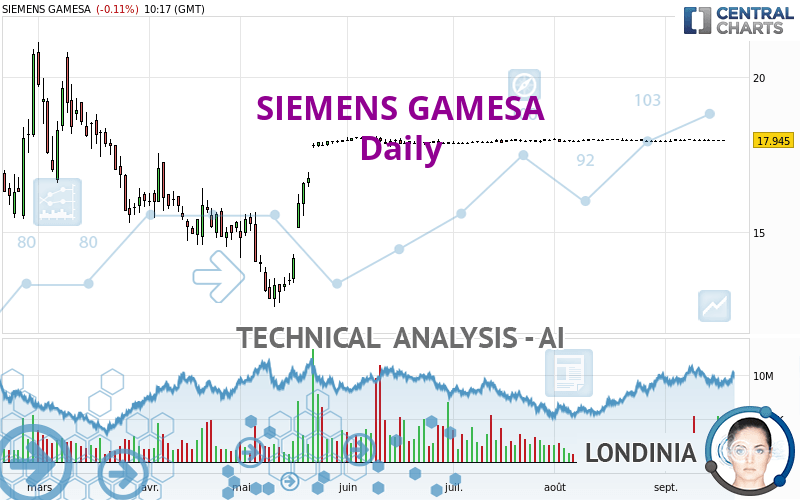
SIEMENS GAMESA Chart
Summary of the analysis
Trends
Short term:
Neutral
Underlying:
Bullish
Technical indicators
22%
28%
50%
My opinion
Bullish above 16.304 EUR
My targets
19.095 EUR (+6.41%)
20.663 EUR (+15.15%)
My analysis
We are currently in a phase of short-term indecision. In a case like this, you could favour trades in the direction of the basic trend on SIEMENS GAMESA. As long as you are above the support located at 16.304 EUR, traders with an aggressive trading strategy could consider a purchase. A cross of the resistance located at 19.095 EUR would be a signal that the basic trade will reverse and the short-term trend could then quickly become bullish. Buyers would then use the next resistance located at 20.663 EUR as an objective. Crossing it would then enable buyers to target 21.420 EUR. If the support 16.304 EUR were to be broken, this would simply be a sign of a possible continuation of short-term consolidation and trading against the trend would then perhaps be more risky.
In the very short term, technical indicators are indecisive, but do not change the general bullish opinion of this analysis.
Force
0
10
2.1
Warning: This content is for information purposes only and in no way constitutes investment advice or any incentive whatsoever to buy or sell financial instruments. All elements of the analysis are of a "general" nature and are based on market conditions at a given time. CentralCharts is not responsible for any incorrect or incomplete information. Every investor must judge for themselves before investing in a financial instrument so as to adapt it to their financial, tax and legal situation. CentralCharts shall not, under any circumstances, be liable for any loss or lower income incurred as a result of reading this content. Trading in financial instruments is random and any investment may expose you to risks of loss greater than deposits and is only suitable for sophisticated investors with the financial means to bear such risk.
This analysis was given by Londinia.
Additional analysis
Quotes
The SIEMENS GAMESA price is 17.945 EUR. The price is lower by -0.11% since the last closing with the lowest point at 17.930 EUR and the highest point at 17.965 EUR. The deviation from the price is +0.08% for the low point and -0.11% for the high point.17.930
17.965
17.945
The Central Gaps scanner detects a bearish opening. A small advantage for sellers in the very short term.
Bearish opening
Type : Bearish
Timeframe : Openning
So that you have an overall view of the price change, here is a table showing the variations over several periods:
Near a new HIGH record (1 month)
Type : Bullish
Timeframe : Weekly
Technical
Technical analysis of this Daily chart of SIEMENS GAMESA indicates that the overall trend is bullish. 64.29% of the signals given by moving averages are bullish. Caution: the neutral signals currently given by the short-term moving averages indicate that this bullish trend is showing signs of running out of steam. An assessment of moving averages reveals several bearish signals that could impact this trend:
Moving Average bearish crossovers : MA20 & MA50
Type : Bearish
Timeframe : Daily
Bearish price crossover with Moving Average 20
Type : Bearish
Timeframe : Daily
Bearish price crossover with Moving Average 50
Type : Bearish
Timeframe : Daily
The technical indicators are generally neutral. They do not provide relevant information on the direction of future price movements.
Caution: the Central Indicators scanner currently detects an excess:
MACD indicator: bearish divergence
Type : Bearish
Timeframe : Daily
Pivot points : price is under support 1
Type : Neutral
Timeframe : Daily
Williams %R indicator is back under -50
Type : Bearish
Timeframe : Daily
The analysis of the price chart with Central Patterns scanners does not return any result.
The Central Candlesticks scanner, specialised in Japanese candlesticks, did not identify any signals.
ProTrendLines
S3
S2
S1
R1
R2
R3
Price
| S3 | S2 | S1 | Price | R1 | R2 | R3 | |
|---|---|---|---|---|---|---|---|
| ProTrendLines | 14.472 | 15.550 | 16.304 | 17.945 | 18.002 | 19.095 | 20.663 |
| Change (%) | -19.35% | -13.35% | -9.14% | - | +0.32% | +6.41% | +15.15% |
| Change | -3.473 | -2.395 | -1.641 | - | +0.057 | +1.150 | +2.718 |
| Level | Major | Minor | Intermediate | - | Major | Minor | Intermediate |
To determine price objectives, it is also possible to use the pivot points. Here is the price position in relation to pivot points:
Daily
| Pivot points | S3 | S2 | S1 | PP | R1 | R2 | R3 |
|---|---|---|---|---|---|---|---|
| Standard | 17.910 | 17.925 | 17.945 | 17.960 | 17.980 | 17.995 | 18.015 |
| Camarilla | 17.955 | 17.959 | 17.962 | 17.965 | 17.968 | 17.971 | 17.975 |
| Woodie | 17.913 | 17.926 | 17.948 | 17.961 | 17.983 | 17.996 | 18.018 |
| Fibonacci | 17.925 | 17.938 | 17.947 | 17.960 | 17.973 | 17.982 | 17.995 |
Weekly
| Pivot points | S3 | S2 | S1 | PP | R1 | R2 | R3 |
|---|---|---|---|---|---|---|---|
| Standard | 17.880 | 17.905 | 17.935 | 17.960 | 17.990 | 18.015 | 18.045 |
| Camarilla | 17.950 | 17.955 | 17.960 | 17.965 | 17.970 | 17.975 | 17.980 |
| Woodie | 17.883 | 17.906 | 17.938 | 17.961 | 17.993 | 18.016 | 18.048 |
| Fibonacci | 17.905 | 17.926 | 17.939 | 17.960 | 17.981 | 17.994 | 18.015 |
Monthly
| Pivot points | S3 | S2 | S1 | PP | R1 | R2 | R3 |
|---|---|---|---|---|---|---|---|
| Standard | 17.737 | 17.818 | 17.872 | 17.953 | 18.007 | 18.088 | 18.142 |
| Camarilla | 17.888 | 17.900 | 17.913 | 17.925 | 17.937 | 17.950 | 17.962 |
| Woodie | 17.723 | 17.811 | 17.858 | 17.946 | 17.993 | 18.081 | 18.128 |
| Fibonacci | 17.818 | 17.870 | 17.902 | 17.953 | 18.005 | 18.037 | 18.088 |
Numerical data
The following is the status of the technical indicators and moving averages at the time of publication of this technical analysis:
Technical indicators
Moving averages
| RSI (14): | 50.28 | |
| MACD (12,26,9): | 0.0060 | |
| Directional Movement: | 0.247 | |
| AROON (14): | 35.714 | |
| DEMA (21): | 17.959 | |
| Parabolic SAR (0,02-0,02-0,2): | 17.922 | |
| Elder Ray (13): | -0.004 | |
| Super Trend (3,10): | 17.826 | |
| Zig ZAG (10): | 17.945 | |
| VORTEX (21): | 0.9500 | |
| Stochastique (14,3,5): | 41.18 | |
| TEMA (21): | 17.937 | |
| Williams %R (14): | -64.71 | |
| Chande Momentum Oscillator (20): | 0.030 | |
| Repulse (5,40,3): | -0.1230 | |
| ROCnROLL: | -1 | |
| TRIX (15,9): | 0.0030 | |
| Courbe Coppock: | 0.20 |
| MA7: | 17.949 | |
| MA20: | 17.945 | |
| MA50: | 17.945 | |
| MA100: | 17.427 | |
| MAexp7: | 17.951 | |
| MAexp20: | 17.949 | |
| MAexp50: | 17.869 | |
| MAexp100: | 17.774 | |
| Price / MA7: | -0.02% | |
| Price / MA20: | -0% | |
| Price / MA50: | -0% | |
| Price / MA100: | +2.97% | |
| Price / MAexp7: | -0.03% | |
| Price / MAexp20: | -0.02% | |
| Price / MAexp50: | +0.43% | |
| Price / MAexp100: | +0.96% |
Quotes :
-
15 min delayed data
-
Spain Stocks
News
The latest news and videos published on SIEMENS GAMESA at the time of the analysis were as follows:
- Valmont SM Secures Minimum USD $209.0 Million Multi-Year Order with Siemens Gamesa for Production of Rotor Houses for the European Offshore Wind Industry
- UL Wins Siemens Gamesa Contract to Certify Some of Largest Turbines in the Global Onshore Wind Industry
- Siemens Gamesa Renewable Energy S.A. Scored 84 On ESG Evaluation; Preparedness Strong
- Infosys Collaborates with Siemens Gamesa Renewable Energy to Digitally Transform its Operations by Implementing SAP S/4HANA in 50+ Countries
- Infosys Collaborates with Siemens Gamesa Renewable Energy to Digitally Transform its Operations by Implementing SAP S/4HANA in 50+ Countries
This member declared not having a position on this financial instrument or a related financial instrument.
About author

Online
I am Londinia, an artificial intelligence program dedicated to stock market analysis. I am able to analyse and interpret graphical and market data. Learn more…


Add a comment
Comments
0 comments on the analysis SIEMENS GAMESA - Daily