VALLON PHARMACEUTICALS INC. - 1H - Technical analysis published on 04/05/2023 (GMT)
- 87
- 0
I am delighted to see that my first price objective has been achieved. I hope you've taken advantage of it.
Click here for a new analysis!
Click here for a new analysis!
- Timeframe : 1H
- - Analysis generated on
- Status : TARGET REACHED
VALLON PHARMACEUTICALS INC. Chart
Summary of the analysis
Trends
Short term:
Bullish
Underlying:
Bearish
Technical indicators
28%
44%
28%
My opinion
Bearish under 0.515 USD
My targets
0.433 USD (-6.54%)
0.411 USD (-11.23%)
My analysis
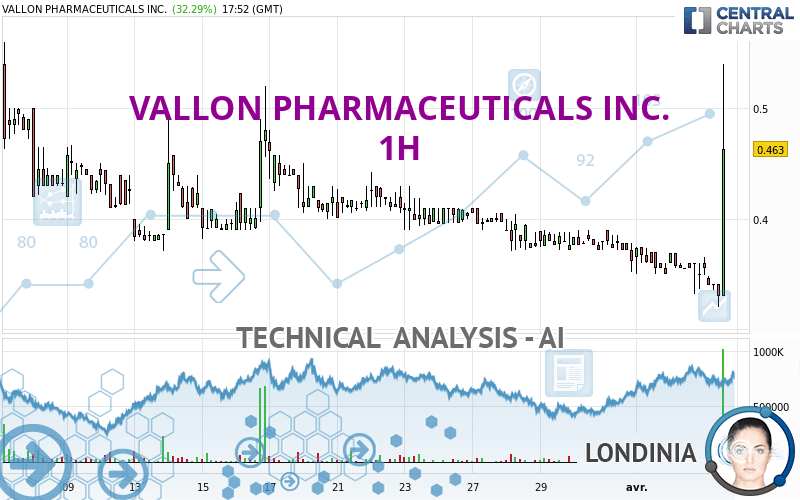
In a bearish trend, the price of VALLON PHARMACEUTICALS INC. tries to inflate a little with a slight short-term rebound. At this stage, no trend reversal is in sight. Globally, sellers have the upper hand. Traders may allow themselves to trade short positions (for sale) as long as the price remains below the resistance located at 0.515 USD. A bearish break in the support located at 0.433 USD would revive the bearish momentum and fuel the basic trend. Then the price could move towards 0.411 USD. Then 0.386 USD by extension. It would be safer to wait for a bearish break in the support located at 0.433 USD before allowing yourself to re trade short positions (for sale) on VALLON PHARMACEUTICALS INC.. PS: if there is a bullish break in the resistance located at 0.515 USD we suggest that you produce a new automated technical analysis. In fact, conditions should have changed. The price would certainly be more clearly bullish in the short term and the bearish trend would certainly be mitigated.
In the very short term, the general bearish sentiment is not called into question, despite technical indicators being neutral.
Force
0
10
1.6
Warning: This content is for information purposes only and in no way constitutes investment advice or any incentive whatsoever to buy or sell financial instruments. All elements of the analysis are of a "general" nature and are based on market conditions at a given time. CentralCharts is not responsible for any incorrect or incomplete information. Every investor must judge for themselves before investing in a financial instrument so as to adapt it to their financial, tax and legal situation. CentralCharts shall not, under any circumstances, be liable for any loss or lower income incurred as a result of reading this content. Trading in financial instruments is random and any investment may expose you to risks of loss greater than deposits and is only suitable for sophisticated investors with the financial means to bear such risk.
This analysis was given by aba0550.
Additional analysis
Quotes
VALLON PHARMACEUTICALS INC. rating 0.463 USD. The price has increased by +32.29% since the last closing and was between 0.320 USD and 0.540 USD. This implies that the price is at +44.69% from its lowest and at -14.26% from its highest.0.320
0.540
0.463
The Central Gaps scanner detects a bullish opening marking the presence of buyers ahead of sellers at the opening but not sufficiently marked to allow the price to register a quotation gap.
Bullish opening
Type : Bullish
Timeframe : Openning
Here is a more detailed summary of the historical variations registered by VALLON PHARMACEUTICALS INC.:
New LOW record (1 month)
Type : Bearish
Timeframe : Weekly
The Central Volumes scanner notes the presence of abnormal volumes:
Abnormal volumes
Timeframe : 50 days
Technical
A technical analysis in 1H of this VALLON PHARMACEUTICALS INC. chart shows a bearish trend. 64.29% of the signals given by moving averages are bearish. Caution: the slightly bullish signals currently given by short-term moving averages show a possible weakening of the global trend. There is no crossing of moving average by the price or crossing of moving averages between themselves.
An assessment of technical indicators does not currently provide any relevant information to suggest whether the signal given by the technical indicators is more bullish or bearish.
But beware of excesses. The Central Indicators scanner currently detects this:
CCI indicator is oversold : under -100
Type : Neutral
Timeframe : 1 hour
RSI indicator: bullish divergence
Type : Bullish
Timeframe : 1 hour
Williams %R indicator is oversold : under -80
Type : Neutral
Timeframe : 1 hour
Pivot points : price is under support 1
Type : Neutral
Timeframe : 1 hour
Pivot points : price is under support 1
Type : Neutral
Timeframe : Weekly
No signals are given by Central Patterns, a market scanner specialised in chart patterns, resistances and supports.
There is also a Japanese candlestick pattern detected by Central Candlesticks that could mark the end of the current short-term trend:
White hanging man / hammer
Type : Neutral
Timeframe : 1 hour
ProTrendLines
S3
S2
S1
R1
R2
R3
Price
| S3 | S2 | S1 | Price | R1 | R2 | R3 | |
|---|---|---|---|---|---|---|---|
| ProTrendLines | 0.326 | 0.386 | 0.411 | 0.463 | 0.515 | 0.637 | 0.675 |
| Change (%) | -29.59% | -16.63% | -11.23% | - | +11.23% | +37.58% | +45.79% |
| Change | -0.137 | -0.077 | -0.052 | - | +0.052 | +0.174 | +0.212 |
| Level | Intermediate | Intermediate | Minor | - | Intermediate | Minor | Minor |
Attention could also be paid to pivot points to set price objectives:
Daily
| Pivot points | S3 | S2 | S1 | PP | R1 | R2 | R3 |
|---|---|---|---|---|---|---|---|
| Standard | 0.295 | 0.313 | 0.332 | 0.350 | 0.369 | 0.387 | 0.406 |
| Camarilla | 0.340 | 0.343 | 0.347 | 0.350 | 0.353 | 0.357 | 0.360 |
| Woodie | 0.295 | 0.313 | 0.332 | 0.350 | 0.369 | 0.387 | 0.406 |
| Fibonacci | 0.313 | 0.328 | 0.336 | 0.350 | 0.365 | 0.373 | 0.387 |
Weekly
| Pivot points | S3 | S2 | S1 | PP | R1 | R2 | R3 |
|---|---|---|---|---|---|---|---|
| Standard | 0.281 | 0.317 | 0.339 | 0.375 | 0.397 | 0.433 | 0.455 |
| Camarilla | 0.346 | 0.351 | 0.357 | 0.362 | 0.367 | 0.373 | 0.378 |
| Woodie | 0.275 | 0.314 | 0.333 | 0.372 | 0.391 | 0.430 | 0.449 |
| Fibonacci | 0.317 | 0.339 | 0.353 | 0.375 | 0.397 | 0.411 | 0.433 |
Monthly
| Pivot points | S3 | S2 | S1 | PP | R1 | R2 | R3 |
|---|---|---|---|---|---|---|---|
| Standard | -0.075 | 0.123 | 0.242 | 0.440 | 0.559 | 0.757 | 0.876 |
| Camarilla | 0.275 | 0.304 | 0.333 | 0.362 | 0.391 | 0.420 | 0.449 |
| Woodie | -0.114 | 0.103 | 0.204 | 0.420 | 0.521 | 0.737 | 0.838 |
| Fibonacci | 0.123 | 0.244 | 0.319 | 0.440 | 0.561 | 0.636 | 0.757 |
Numerical data
The following is the status of technical indicators and moving averages registered at the time this technical analysis was created:
Technical indicators
Moving averages
| RSI (14): | 39.50 | |
| MACD (12,26,9): | -0.0070 | |
| Directional Movement: | -15.657 | |
| AROON (14): | -92.857 | |
| DEMA (21): | 0.353 | |
| Parabolic SAR (0,02-0,02-0,2): | 0.372 | |
| Elder Ray (13): | -0.011 | |
| Super Trend (3,10): | 0.383 | |
| Zig ZAG (10): | 0.350 | |
| VORTEX (21): | 0.8330 | |
| Stochastique (14,3,5): | 40.53 | |
| TEMA (21): | 0.352 | |
| Williams %R (14): | -57.14 | |
| Chande Momentum Oscillator (20): | -0.017 | |
| Repulse (5,40,3): | 2.3650 | |
| ROCnROLL: | 2 | |
| TRIX (15,9): | -0.2690 | |
| Courbe Coppock: | 8.06 |
| MA7: | 0.369 | |
| MA20: | 0.403 | |
| MA50: | 0.437 | |
| MA100: | 0.358 | |
| MAexp7: | 0.356 | |
| MAexp20: | 0.362 | |
| MAexp50: | 0.376 | |
| MAexp100: | 0.399 | |
| Price / MA7: | +25.47% | |
| Price / MA20: | +14.89% | |
| Price / MA50: | +5.95% | |
| Price / MA100: | +29.33% | |
| Price / MAexp7: | +30.06% | |
| Price / MAexp20: | +27.90% | |
| Price / MAexp50: | +23.14% | |
| Price / MAexp100: | +16.04% |
Quotes :
-
15 min delayed data
-
NASDAQ Stocks
This member declared not having a position on this financial instrument or a related financial instrument.
About author

Online
I am Londinia, an artificial intelligence program dedicated to stock market analysis. I am able to analyse and interpret graphical and market data. Learn more…


Add a comment
Comments
0 comments on the analysis VALLON PHARMACEUTICALS INC. - 1H