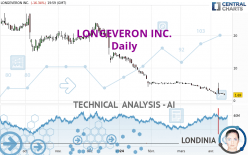
LONGEVERON INC. - Daily - Technical analysis published on 04/12/2024 (GMT)
- 93
- 0
Click here for a new analysis!
- Timeframe : Daily
- - Analysis generated on
- Status : INVALID

Summary of the analysis

Additional analysis
Quotes
The LONGEVERON INC. rating is 1.69 USD. On the day, this instrument lost -16.34% with the lowest point at 1.63 USD and the highest point at 2.15 USD. The deviation from the price is +3.68% for the low point and -21.40% for the high point.The Central Gaps scanner detects a bullish opening. A small advantage for buyers in the very short term.
Bullish opening
Type : Bullish
Timeframe : Openning
So that you have an overall view of the price change, here is a table showing the variations over several periods:
Near a new LOW record (5 years)
Type : Bearish
Timeframe : Weekly
Near a new LOW record (1 year)
Type : Bearish
Timeframe : Weekly
Near a new LOW record (1st january)
Type : Bearish
Timeframe : Weekly
Near a new LOW record (1 month)
Type : Bearish
Timeframe : Weekly
The Central Volumes scanner detects abnormal volumes on the asset:
Abnormal volumes
Timeframe : 5 days
Abnormal volumes
Timeframe : 20 days
Abnormal volumes
Timeframe : 50 days
Technical
Technical analysis of LONGEVERON INC. in Daily shows a overall strongly bearish trend. The signals given by moving averages are 92.86% bearish. This strong bearish trend is confirmed by the strong signals currently being given by short-term moving averages. The Central Indicators market scanner currently does not detect any result that concerns moving averages.
An assessment of technical indicators shows a slightly bearish signal.
Caution: the Central Indicators scanner currently detects an excess:
RSI indicator is oversold : under 30
Type : Neutral
Timeframe : Daily
CCI indicator is oversold : under -100
Type : Neutral
Timeframe : Daily
Williams %R indicator is oversold : under -80
Type : Neutral
Timeframe : Daily
Pivot points : price is under support 1
Type : Neutral
Timeframe : Daily
Parabolic SAR indicator bearish reversal
Type : Bearish
Timeframe : Daily
Price is back under the pivot point
Type : Bearish
Timeframe : Weekly
Central Patterns, the scanner specializing in chart patterns, did not identify any signals.
No result was found by the Central Candlesticks scanner on Japanese candlesticks.
| Price | R1 | R2 | R3 | |
|---|---|---|---|---|
| ProTrendLines | 1.69 | 2.03 | 5.11 | 16.50 |
| Change (%) | - | +20.12% | +202.37% | +876.33% |
| Change | - | +0.34 | +3.42 | +14.81 |
| Level | - | Major | Minor | Minor |
Attention could also be paid to pivot points to set price objectives:
| Pivot points | S3 | S2 | S1 | PP | R1 | R2 | R3 |
|---|---|---|---|---|---|---|---|
| Standard | 0.98 | 1.30 | 1.50 | 1.82 | 2.02 | 2.34 | 2.54 |
| Camarilla | 1.55 | 1.60 | 1.64 | 1.69 | 1.74 | 1.79 | 1.83 |
| Woodie | 0.91 | 1.27 | 1.43 | 1.79 | 1.95 | 2.31 | 2.47 |
| Fibonacci | 1.30 | 1.50 | 1.63 | 1.82 | 2.02 | 2.15 | 2.34 |
| Pivot points | S3 | S2 | S1 | PP | R1 | R2 | R3 |
|---|---|---|---|---|---|---|---|
| Standard | -3.45 | -0.91 | 0.39 | 2.93 | 4.23 | 6.77 | 8.07 |
| Camarilla | 0.63 | 0.99 | 1.34 | 1.69 | 2.04 | 2.39 | 2.75 |
| Woodie | -4.07 | -1.22 | -0.23 | 2.62 | 3.61 | 6.46 | 7.45 |
| Fibonacci | -0.91 | 0.56 | 1.46 | 2.93 | 4.40 | 5.30 | 6.77 |
| Pivot points | S3 | S2 | S1 | PP | R1 | R2 | R3 |
|---|---|---|---|---|---|---|---|
| Standard | -0.33 | 1.30 | 2.27 | 3.90 | 4.87 | 6.50 | 7.47 |
| Camarilla | 2.54 | 2.77 | 3.01 | 3.25 | 3.49 | 3.73 | 3.97 |
| Woodie | -0.65 | 1.14 | 1.95 | 3.74 | 4.55 | 6.34 | 7.15 |
| Fibonacci | 1.30 | 2.29 | 2.90 | 3.90 | 4.89 | 5.50 | 6.50 |
Numerical data
The following is the status of technical indicators and moving averages registered at the time this technical analysis was created:
| RSI (14): | 23.21 | |
| MACD (12,26,9): | -0.8600 | |
| Directional Movement: | 9.83 | |
| AROON (14): | 7.14 | |
| DEMA (21): | 1.96 | |
| Parabolic SAR (0,02-0,02-0,2): | 1.91 | |
| Elder Ray (13): | -0.54 | |
| Super Trend (3,10): | 3.44 | |
| Zig ZAG (10): | 2.02 | |
| VORTEX (21): | 0.7700 | |
| Stochastique (14,3,5): | 8.17 | |
| TEMA (21): | 1.99 | |
| Williams %R (14): | -95.04 | |
| Chande Momentum Oscillator (20): | -2.01 | |
| Repulse (5,40,3): | -47.7100 | |
| ROCnROLL: | 2 | |
| TRIX (15,9): | -2.5100 | |
| Courbe Coppock: | 91.13 |
| MA7: | 2.18 | |
| MA20: | 3.20 | |
| MA50: | 4.44 | |
| MA100: | 9.92 | |
| MAexp7: | 2.30 | |
| MAexp20: | 3.10 | |
| MAexp50: | 5.19 | |
| MAexp100: | 9.16 | |
| Price / MA7: | -22.48% | |
| Price / MA20: | -47.19% | |
| Price / MA50: | -61.94% | |
| Price / MA100: | -82.96% | |
| Price / MAexp7: | -26.52% | |
| Price / MAexp20: | -45.48% | |
| Price / MAexp50: | -67.44% | |
| Price / MAexp100: | -81.55% |
News
Don't forget to follow the news on LONGEVERON INC.. At the time of publication of this analysis, the latest news was as follows:
- Longeveron Announces Closing of $5.2 Million Public Offering
- Longeveron Announces Pricing of $5.25 Million Public Offering
- Longeveron Issues Letter to Shareholders Highlighting Corporate Strategy, Clinical Pipeline and 2024 Key Priorities and Goals
- Longeveron Announces 1-for-10 Reverse Stock Split
- Longeveron Reports Year-End 2023 Results and Provides Corporate Update
About author

Online


Add a comment
Comments
0 comments on the analysis LONGEVERON INC. - Daily