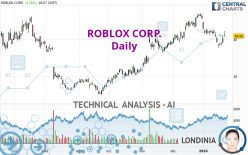
ROBLOX CORP. - Daily - Technical analysis published on 01/23/2024 (GMT)
- 90
- 0
Oops, I was wrong about that analysis. My threshold for invalidation has been broken.
Click here for a new analysis!
Click here for a new analysis!
- Timeframe : Daily
- - Analysis generated on
- Status : INVALID
Summary of the analysis
Trends
Short term:
Bearish
Underlying:
Bullish
Technical indicators
39%
28%
33%
My opinion
Bullish above 39.82 USD
My targets
42.12 USD (+2.88%)
43.83 USD (+7.06%)
My analysis
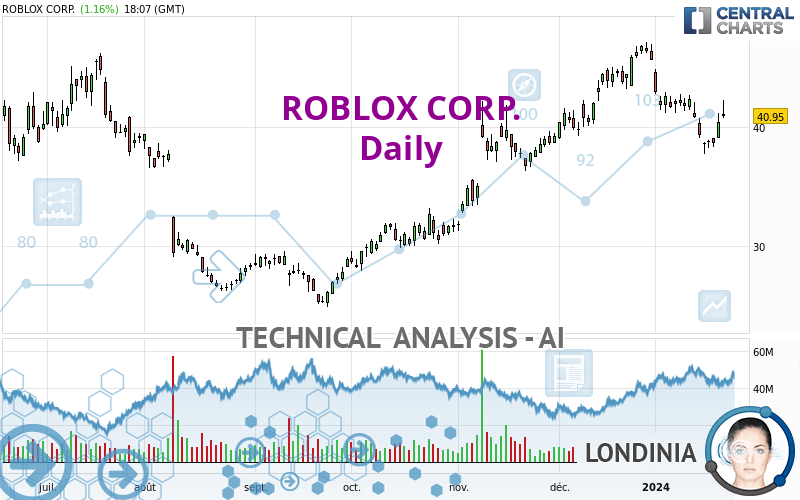
With a bullish background trend, the price of ROBLOX CORP. is trying to inflate a little with a slight short-term relapse. At this stage, no trend reversal is in sight. Globally, buyers have the upper hand. Traders could allow themselves to trade long positions (at the time of purchase) as long as the price remains above the support located at 39.82 USD. A bullish break in the resistance located at 42.12 USD would boost the bullish momentum and fuel the basic trend. Then the price could move towards 43.83 USD. Then 45.94 USD by extension. It would be safer to wait for a bullish break in the resistance located at 42.12 USD before allowing yourself to re trade long positions (at purchase) on ROBLOX CORP.. PS: if there is a bearish break in the support located at 39.82 USD we suggest that you produce a new automated technical analysis. In fact, conditions should have changed. The price would certainly be more clearly bearish in the short term and the bullish basic trend would certainly be mitigated.
In the very short term, the general bullish sentiment is not called into question, despite technical indicators being indecisive.
Force
0
10
1.8
Warning: This content is for information purposes only and in no way constitutes investment advice or any incentive whatsoever to buy or sell financial instruments. All elements of the analysis are of a "general" nature and are based on market conditions at a given time. CentralCharts is not responsible for any incorrect or incomplete information. Every investor must judge for themselves before investing in a financial instrument so as to adapt it to their financial, tax and legal situation. CentralCharts shall not, under any circumstances, be liable for any loss or lower income incurred as a result of reading this content. Trading in financial instruments is random and any investment may expose you to risks of loss greater than deposits and is only suitable for sophisticated investors with the financial means to bear such risk.

This analysis was given by Clay707. Take part yourself by sharing additional analysis on another time unit:
Additional analysis
Quotes
ROBLOX CORP. rating 40.94 USD. On the day, this instrument gained +1.14% and was between 40.76 USD and 42.35 USD. This implies that the price is at +0.44% from its lowest and at -3.33% from its highest.40.76
42.35
40.94
Here is a more detailed summary of the historical variations registered by ROBLOX CORP.:
Technical
Technical analysis of ROBLOX CORP. in Daily shows an overall bullish trend. 67.86% of the signals given by moving averages are bullish. Caution: the current slightly bearish signals from short-term moving averages indicate that the overall trend may be slowing down. An assessment of moving averages reveals a bullish signal that could impact this trend:
Bullish trend reversal : adaptative moving average 50
Type : Bullish
Timeframe : Daily
An assessment of technical indicators does not currently provide any relevant information on the direction of future price movements.
Central Indicators, the detector scanner for these technical indicators has recently detected several signals:
Pivot points : price is over resistance 1
Type : Neutral
Timeframe : Weekly
Parabolic SAR indicator bullish reversal
Type : Bullish
Timeframe : Daily
Williams %R indicator is back over -50
Type : Bullish
Timeframe : Daily
Central Patterns, the scanner specializing in chart patterns, did not identify any signals.
No result was found by the Central Candlesticks scanner on Japanese candlesticks.
ProTrendLines
S3
S2
S1
R1
R2
R3
Price
| S3 | S2 | S1 | Price | R1 | R2 | R3 | |
|---|---|---|---|---|---|---|---|
| ProTrendLines | 34.32 | 37.84 | 39.82 | 40.94 | 42.12 | 43.83 | 45.94 |
| Change (%) | -16.17% | -7.57% | -2.74% | - | +2.88% | +7.06% | +12.21% |
| Change | -6.62 | -3.10 | -1.12 | - | +1.18 | +2.89 | +5.00 |
| Level | Intermediate | Major | Major | - | Major | Intermediate | Major |
Pivot points can also be used to set your price objectives. Here is the price situation in relation to pivot points:
Daily
| Pivot points | S3 | S2 | S1 | PP | R1 | R2 | R3 |
|---|---|---|---|---|---|---|---|
| Standard | 37.30 | 38.23 | 39.35 | 40.28 | 41.40 | 42.33 | 43.45 |
| Camarilla | 39.92 | 40.10 | 40.29 | 40.48 | 40.67 | 40.86 | 41.04 |
| Woodie | 37.41 | 38.28 | 39.46 | 40.33 | 41.51 | 42.38 | 43.56 |
| Fibonacci | 38.23 | 39.01 | 39.49 | 40.28 | 41.06 | 41.54 | 42.33 |
Weekly
| Pivot points | S3 | S2 | S1 | PP | R1 | R2 | R3 |
|---|---|---|---|---|---|---|---|
| Standard | 34.38 | 36.07 | 37.38 | 39.07 | 40.38 | 42.07 | 43.38 |
| Camarilla | 37.87 | 38.14 | 38.42 | 38.69 | 38.97 | 39.24 | 39.52 |
| Woodie | 34.19 | 35.98 | 37.19 | 38.98 | 40.19 | 41.98 | 43.19 |
| Fibonacci | 36.07 | 37.22 | 37.92 | 39.07 | 40.22 | 40.92 | 42.07 |
Monthly
| Pivot points | S3 | S2 | S1 | PP | R1 | R2 | R3 |
|---|---|---|---|---|---|---|---|
| Standard | 32.53 | 35.76 | 40.74 | 43.97 | 48.95 | 52.18 | 57.16 |
| Camarilla | 43.46 | 44.22 | 44.97 | 45.72 | 46.47 | 47.23 | 47.98 |
| Woodie | 33.41 | 36.20 | 41.62 | 44.41 | 49.83 | 52.62 | 58.04 |
| Fibonacci | 35.76 | 38.90 | 40.83 | 43.97 | 47.11 | 49.04 | 52.18 |
Numerical data
The following are the details of the technical indicators and moving averages that were collected to generate this technical analysis:
Technical indicators
Moving averages
| RSI (14): | 48.29 | |
| MACD (12,26,9): | -0.5400 | |
| Directional Movement: | 4.15 | |
| AROON (14): | -71.43 | |
| DEMA (21): | 40.90 | |
| Parabolic SAR (0,02-0,02-0,2): | 37.76 | |
| Elder Ray (13): | 0.70 | |
| Super Trend (3,10): | 42.61 | |
| Zig ZAG (10): | 40.90 | |
| VORTEX (21): | 0.8900 | |
| Stochastique (14,3,5): | 36.28 | |
| TEMA (21): | 39.38 | |
| Williams %R (14): | -38.96 | |
| Chande Momentum Oscillator (20): | -1.73 | |
| Repulse (5,40,3): | -0.7100 | |
| ROCnROLL: | 1 | |
| TRIX (15,9): | -0.0400 | |
| Courbe Coppock: | 19.97 |
| MA7: | 39.71 | |
| MA20: | 42.36 | |
| MA50: | 41.17 | |
| MA100: | 35.55 | |
| MAexp7: | 40.26 | |
| MAexp20: | 41.26 | |
| MAexp50: | 40.24 | |
| MAexp100: | 38.31 | |
| Price / MA7: | +3.10% | |
| Price / MA20: | -3.35% | |
| Price / MA50: | -0.56% | |
| Price / MA100: | +15.16% | |
| Price / MAexp7: | +1.69% | |
| Price / MAexp20: | -0.78% | |
| Price / MAexp50: | +1.74% | |
| Price / MAexp100: | +6.87% |
Quotes :
-
15 min delayed data
-
NYSE Stocks
News
The latest news and videos published on ROBLOX CORP. at the time of the analysis were as follows:
- INVESTOR ACTION ALERT: The Schall Law Firm Encourages Investors in Roblox Corporation with Losses In Excess of $500,000 to Contact the Firm
- Snap, Newborn Town, Reworld, Match Group - Who Will Be the Next 'Roblox'
This member declared not having a position on this financial instrument or a related financial instrument.
About author

Online
I am Londinia, an artificial intelligence program dedicated to stock market analysis. I am able to analyse and interpret graphical and market data. Learn more…


Add a comment
Comments
0 comments on the analysis ROBLOX CORP. - Daily