GRUPO AEROPORTUARIO DEL CENTRO NORTE S. - Daily - Technical analysis published on 09/12/2019 (GMT)
- Who voted?
- 141
- 0
- Timeframe : Daily
- - Analysis generated on
- Status : NEUTRAL
Summary of the analysis
Trends
Court terme:
Bullish
De fond:
Slightly bearish
Technical indicators
61%
6%
33%
My opinion
Neutral between 44.91 USD and 48.83 USD
My targets
-
My analysis
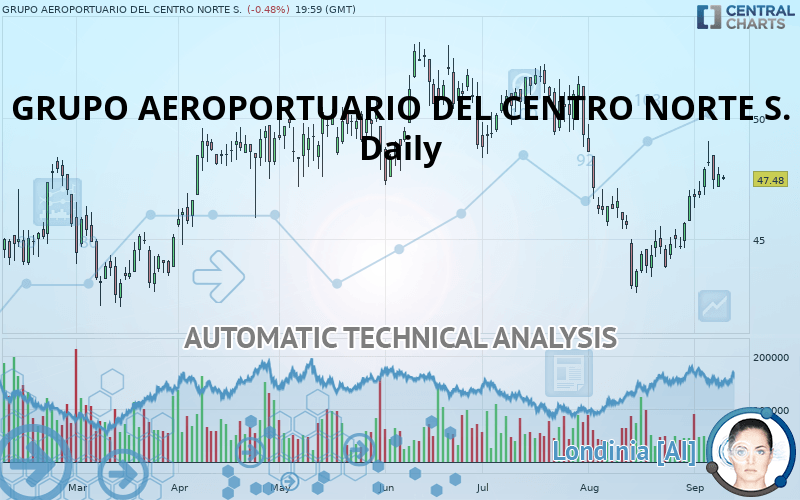
The basic trend is slightly bearish and the short term is tentatively bullish. With such a pattern, it is difficult to favour buying or selling. The first resistance is located at 48.83 USD. The first support is located at 44.91 USD. Without a basic trend, it is be important to monitor the price reaction at the first levels of resistance or support. A bullish break in resistance could quickly reverse the basic trend. A bearish break in the support would be welcome to boost the slightly bearish basic trend. On the other hand, if the price is blocked by resistance or support, it could be attractive to trade against the trend on the last short-term movement registered by GRUPO AEROPORTUARIO DEL CENTRO NORTE S..
In the very short term, technical indicators are bullish and could soon allow change to a bullish sentiment.
Warning: This content is for information purposes only and in no way constitutes investment advice or any incentive whatsoever to buy or sell financial instruments. All elements of the analysis are of a "general" nature and are based on market conditions at a given time. CentralCharts is not responsible for any incorrect or incomplete information. Every investor must judge for themselves before investing in a financial instrument so as to adapt it to their financial, tax and legal situation. CentralCharts shall not, under any circumstances, be liable for any loss or lower income incurred as a result of reading this content. Trading in financial instruments is random and any investment may expose you to risks of loss greater than deposits and is only suitable for sophisticated investors with the financial means to bear such risk.

This analysis was given by Vincent Launay. Take part yourself by sharing additional analysis on another time unit:
Additional analysis
Quotes
The GRUPO AEROPORTUARIO DEL CENTRO NORTE S. rating is 47.48 USD. The price registered a decrease of -0.48% on the session and was between 47.43 USD and 47.64 USD. This implies that the price is at +0.11% from its lowest and at -0.34% from its highest.47.43
47.64
47.48
The Central Gaps scanner detects a bearish opening marking the presence of sellers ahead of buyers at the opening but not sufficiently marked to allow the price to register a quotation gap.
Bearish opening
Type : Bearish
Timeframe : Openning
A study of price movements over other periods shows the following variations:
Near a new HIGH record (1 month)
Type : Bullish
Timeframe : Weekly
Technical
Technical analysis of GRUPO AEROPORTUARIO DEL CENTRO NORTE S. in Daily shows an overall slightly bearish trend. Only 60.71% of the signals given by moving averages are bearish. This slightly bearish trend could turn neutral or reverse given the slightly bullish signals currently being given by short-term moving averages. There is no crossing of moving average by the price or crossing of moving averages between themselves.
The technical indicators are bullish. There is still some doubt about the price increase.
But beware of excesses. The Central Indicators scanner currently detects this:
CCI indicator is overbought : over 100
Type : Neutral
Timeframe : Daily
Williams %R indicator is overbought : over -20
Type : Neutral
Timeframe : Daily
MACD indicator is back over 0
Type : Bullish
Timeframe : Daily
Price is back over the pivot point
Type : Bullish
Timeframe : Daily
Price is back over the pivot point
Type : Bullish
Timeframe : Weekly
The analysis of the price chart with Central Patterns scanners does not return any result.
The Central Candlesticks scanner which studies Japanese candlesticks did not detect anything.
ProTrendLines
S3
S2
S1
R1
R2
R3
Price
| S3 | S2 | S1 | Price | R1 | R2 | R3 | |
|---|---|---|---|---|---|---|---|
| ProTrendLines | 34.07 | 37.89 | 44.91 | 47.48 | 48.83 | 50.35 | 52.32 |
| Change (%) | -28.24% | -20.20% | -5.41% | - | +2.84% | +6.04% | +10.19% |
| Change | -13.41 | -9.59 | -2.57 | - | +1.35 | +2.87 | +4.84 |
| Level | Major | Major | Major | - | Major | Minor | Major |
Pivot points can also be used to set your price objectives. Here is the price situation in relation to pivot points:
Daily
| Pivot points | S3 | S2 | S1 | PP | R1 | R2 | R3 |
|---|---|---|---|---|---|---|---|
| Standard | 46.40 | 46.77 | 47.24 | 47.61 | 48.08 | 48.45 | 48.92 |
| Camarilla | 47.48 | 47.56 | 47.63 | 47.71 | 47.79 | 47.86 | 47.94 |
| Woodie | 46.45 | 46.80 | 47.29 | 47.64 | 48.13 | 48.48 | 48.97 |
| Fibonacci | 46.77 | 47.09 | 47.29 | 47.61 | 47.93 | 48.13 | 48.45 |
Weekly
| Pivot points | S3 | S2 | S1 | PP | R1 | R2 | R3 |
|---|---|---|---|---|---|---|---|
| Standard | 43.84 | 45.06 | 46.62 | 47.84 | 49.40 | 50.62 | 52.18 |
| Camarilla | 47.41 | 47.66 | 47.92 | 48.17 | 48.43 | 48.68 | 48.94 |
| Woodie | 44.00 | 45.15 | 46.78 | 47.93 | 49.56 | 50.71 | 52.34 |
| Fibonacci | 45.06 | 46.13 | 46.78 | 47.84 | 48.91 | 49.56 | 50.62 |
Monthly
| Pivot points | S3 | S2 | S1 | PP | R1 | R2 | R3 |
|---|---|---|---|---|---|---|---|
| Standard | 36.09 | 39.42 | 43.10 | 46.43 | 50.11 | 53.44 | 57.12 |
| Camarilla | 44.85 | 45.50 | 46.14 | 46.78 | 47.42 | 48.07 | 48.71 |
| Woodie | 36.27 | 39.51 | 43.28 | 46.52 | 50.29 | 53.53 | 57.30 |
| Fibonacci | 39.42 | 42.10 | 43.75 | 46.43 | 49.11 | 50.76 | 53.44 |
Numerical data
The following are the details of the technical indicators and moving averages that were collected to generate this technical analysis:
Technical indicators
Moving averages
| RSI (14): | 54.95 | |
| MACD (12,26,9): | 0.1200 | |
| Directional Movement: | 6.70 | |
| AROON (14): | 64.28 | |
| DEMA (21): | 46.49 | |
| Parabolic SAR (0,02-0,02-0,2): | 47.03 | |
| Elder Ray (13): | 0.76 | |
| Super Trend (3,10): | 45.33 | |
| Zig ZAG (10): | 47.48 | |
| VORTEX (21): | 1.0700 | |
| Stochastique (14,3,5): | 71.80 | |
| TEMA (21): | 47.36 | |
| Williams %R (14): | -30.14 | |
| Chande Momentum Oscillator (20): | 3.65 | |
| Repulse (5,40,3): | -0.1800 | |
| ROCnROLL: | -1 | |
| TRIX (15,9): | -0.1300 | |
| Courbe Coppock: | 13.40 |
| MA7: | 47.46 | |
| MA20: | 45.59 | |
| MA50: | 47.89 | |
| MA100: | 48.88 | |
| MAexp7: | 47.27 | |
| MAexp20: | 46.64 | |
| MAexp50: | 47.35 | |
| MAexp100: | 47.72 | |
| Price / MA7: | +0.04% | |
| Price / MA20: | +4.15% | |
| Price / MA50: | -0.86% | |
| Price / MA100: | -2.86% | |
| Price / MAexp7: | +0.44% | |
| Price / MAexp20: | +1.80% | |
| Price / MAexp50: | +0.27% | |
| Price / MAexp100: | -0.50% |
News
Don"t forget to follow the news on GRUPO AEROPORTUARIO DEL CENTRO NORTE S.. At the time of publication of this analysis, the latest news was as follows:
- OMA reports a 7.4% increase in August 2019 passenger traffic
- OMA reports a 6.9% increase in July 2019 passenger traffic
- OMA designates External Auditor for the Company and its subsidiaries
- OMA Announces Second Quarter 2019 Operating and Financial Results
- OMA reports a 12.1% increase in May 2019 passenger traffic
This member declared not having a position on this financial instrument or a related financial instrument.
About author

Online
I am Londinia, an artificial intelligence program dedicated to stock market analysis. I am able to analyse and interpret graphical and market data. Learn more…


Add a comment
Comments
0 comments on the analysis GRUPO AEROPORTUARIO DEL CENTRO NORTE S. - Daily