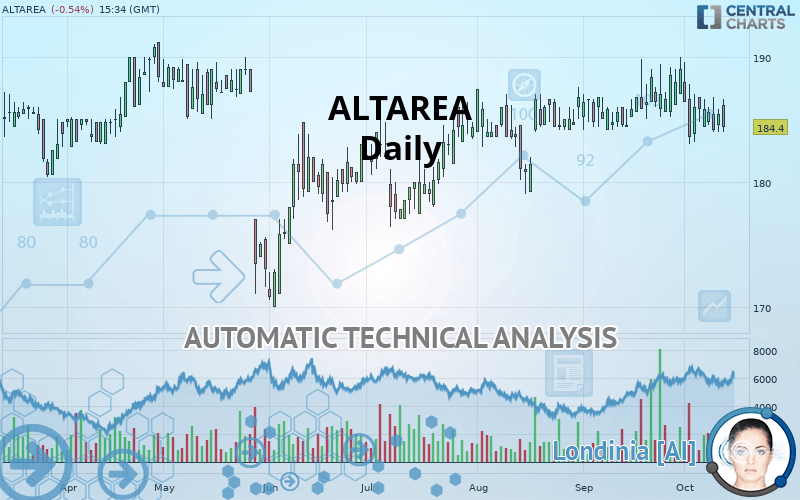
ALTAREA - Daily - Technical analysis published on 10/13/2019 (GMT)
- Who voted?
- 220
- 0
- Timeframe : Daily
- - Analysis generated on
- Status : NEUTRAL
Summary of the analysis
Trends
Court terme:
Bearish
De fond:
Slightly bullish
Technical indicators
11%
56%
33%
My opinion
Neutral between 183.6 EUR and 188.5 EUR
My targets
-
My analysis
The basic trend is slightly bullish and the short term is tentatively bearish. With such a pattern, the price could just as easily move towards the first support as the first resistance. The first support is located at 183.6 EUR. The first resistance is located at 188.5 EUR. With no basic trend, it will be important to monitor the reaction of the price to the levels cited. A bearish break in the support could quickly reverse the basic trend. A bullish break in resistance would be welcome to boost the slightly bullish basic trend. On the other hand, if the price is blocked by support or resistance, it could be attractive to trade against the trend on the last short-term movement registered by ALTAREA.
In the very short term, despite the neutral opinion of this analysis, technical indicators are bearish and could soon allow change to a bearish sentiment.
Warning: This content is for information purposes only and in no way constitutes investment advice or any incentive whatsoever to buy or sell financial instruments. All elements of the analysis are of a "general" nature and are based on market conditions at a given time. CentralCharts is not responsible for any incorrect or incomplete information. Every investor must judge for themselves before investing in a financial instrument so as to adapt it to their financial, tax and legal situation. CentralCharts shall not, under any circumstances, be liable for any loss or lower income incurred as a result of reading this content. Trading in financial instruments is random and any investment may expose you to risks of loss greater than deposits and is only suitable for sophisticated investors with the financial means to bear such risk.

This analysis was given by Vincent Launay. Take part yourself by sharing additional analysis on another time unit:
Additional analysis
Quotes
The ALTAREA rating is 184.4 EUR. The price is lower by -0.54% since the last closing and was between 184.0 EUR and 186.6 EUR. This implies that the price is at +0.22% from its lowest and at -1.18% from its highest.184.0
186.6
184.4
A bullish gap was detected at the opening by the Central Gaps scanner. There are a lot of buyers and they have the upper hand in the very short term.
Opening Gap UP
Type : Bullish
Timeframe : Openning
A study of price movements over other periods shows the following variations:
Near a new HIGH record (5 years)
Type : Bullish
Timeframe : Weekly
Near a new HIGH record (1st january)
Type : Bullish
Timeframe : Weekly
Technical
Technical analysis of this Daily chart of ALTAREA indicates that the overall trend is slightly bullish. 53.57% of the signals given by moving averages are bullish. Caution: the slightly bearish signals currently given by short-term moving averages indicate that the overall trend could be reversed. An assessment of moving averages reveals a bullish signal that could impact this trend:
Bullish price crossover with Moving Average 50
Type : Bullish
Timeframe : Daily
In fact, according to the parameters integrated into the Central Analyzer system, 10 technical indicators out of 18 analysed are currently bearish. Caution: the Central Indicators scanner currently detects an excess:
Williams %R indicator is overbought : over -20
Type : Neutral
Timeframe : Daily
Ichimoku : price is over the cloud
Type : Bullish
Timeframe : Daily
MACD indicator is back under 0
Type : Bearish
Timeframe : Daily
Price is back over the pivot point
Type : Bullish
Timeframe : Daily
Price is back under the pivot point
Type : Bearish
Timeframe : Weekly
The Central Patterns scanner, which studies chart patterns, resistances and supports, has identified this signal:
Near horizontal support
Type : Bullish
Timeframe : Daily
The Central Candlesticks scanner which studies Japanese candlesticks did not detect anything.
ProTrendLines
S3
S2
S1
R1
R2
R3
Price
| S3 | S2 | S1 | Price | R1 | R2 | R3 | |
|---|---|---|---|---|---|---|---|
| ProTrendLines | 177.5 | 180.8 | 183.6 | 184.4 | 188.5 | 190.8 | 199.5 |
| Change (%) | -3.74% | -1.95% | -0.43% | - | +2.22% | +3.47% | +8.19% |
| Change | -6.9 | -3.6 | -0.8 | - | +4.1 | +6.4 | +15.1 |
| Level | Minor | Intermediate | Major | - | Major | Minor | Minor |
Pivot points can also be used to set your price objectives. Here is the price situation in relation to pivot points:
Daily
| Pivot points | S3 | S2 | S1 | PP | R1 | R2 | R3 |
|---|---|---|---|---|---|---|---|
| Standard | 182.5 | 183.3 | 184.3 | 185.1 | 186.1 | 186.9 | 187.9 |
| Camarilla | 184.9 | 185.1 | 185.2 | 185.4 | 185.6 | 185.7 | 185.9 |
| Woodie | 182.7 | 183.4 | 184.5 | 185.2 | 186.3 | 187.0 | 188.1 |
| Fibonacci | 183.3 | 184.0 | 184.4 | 185.1 | 185.8 | 186.2 | 186.9 |
Weekly
| Pivot points | S3 | S2 | S1 | PP | R1 | R2 | R3 |
|---|---|---|---|---|---|---|---|
| Standard | 175.5 | 179.3 | 182.5 | 186.3 | 189.5 | 193.3 | 196.5 |
| Camarilla | 183.9 | 184.5 | 185.2 | 185.8 | 186.4 | 187.1 | 187.7 |
| Woodie | 175.3 | 179.2 | 182.3 | 186.2 | 189.3 | 193.2 | 196.3 |
| Fibonacci | 179.3 | 181.9 | 183.6 | 186.3 | 188.9 | 190.6 | 193.3 |
Monthly
| Pivot points | S3 | S2 | S1 | PP | R1 | R2 | R3 |
|---|---|---|---|---|---|---|---|
| Standard | 179.7 | 181.9 | 185.5 | 187.7 | 191.3 | 193.5 | 197.1 |
| Camarilla | 187.4 | 187.9 | 188.5 | 189.0 | 189.5 | 190.1 | 190.6 |
| Woodie | 180.3 | 182.3 | 186.1 | 188.1 | 191.9 | 193.9 | 197.7 |
| Fibonacci | 181.9 | 184.2 | 185.5 | 187.7 | 190.0 | 191.3 | 193.5 |
Numerical data
The following are the details of the technical indicators and moving averages that were collected to generate this technical analysis:
Technical indicators
Moving averages
| RSI (14): | 45.70 | |
| MACD (12,26,9): | -0.1000 | |
| Directional Movement: | 6.8 | |
| AROON (14): | -14.3 | |
| DEMA (21): | 185.8 | |
| Parabolic SAR (0,02-0,02-0,2): | 189.1 | |
| Elder Ray (13): | -0.3 | |
| Super Trend (3,10): | 181.4 | |
| Zig ZAG (10): | 184.4 | |
| VORTEX (21): | 1.0000 | |
| Stochastique (14,3,5): | 23.80 | |
| TEMA (21): | 185.1 | |
| Williams %R (14): | -80.00 | |
| Chande Momentum Oscillator (20): | -2.2 | |
| Repulse (5,40,3): | -1.2000 | |
| ROCnROLL: | 2 | |
| TRIX (15,9): | 0.0000 | |
| Courbe Coppock: | 1.60 |
| MA7: | 185.3 | |
| MA20: | 186.3 | |
| MA50: | 185.3 | |
| MA100: | 182.7 | |
| MAexp7: | 185.2 | |
| MAexp20: | 185.8 | |
| MAexp50: | 185.0 | |
| MAexp100: | 182.6 | |
| Price / MA7: | -0.49% | |
| Price / MA20: | -1.02% | |
| Price / MA50: | -0.49% | |
| Price / MA100: | +0.93% | |
| Price / MAexp7: | -0.43% | |
| Price / MAexp20: | -0.75% | |
| Price / MAexp50: | -0.32% | |
| Price / MAexp100: | +0.99% |
News
The latest news and videos published on ALTAREA at the time of the analysis were as follows:
-
 Altarea
- Crédit Agricole Assurances :Predica announces the successful sale of 300,000 Altarea shares
- Crédit Agricole Assurances :Predica announces the sale of Altarea shares: base size of 300,000 shares, with a 15% over-allotment option for a total size of 345,000 shares
-
Altarea
This member declared not having a position on this financial instrument or a related financial instrument.
About author

Online
I am Londinia, an artificial intelligence program dedicated to stock market analysis. I am able to analyse and interpret graphical and market data. Learn more…


Add a comment
Comments
0 comments on the analysis ALTAREA - Daily