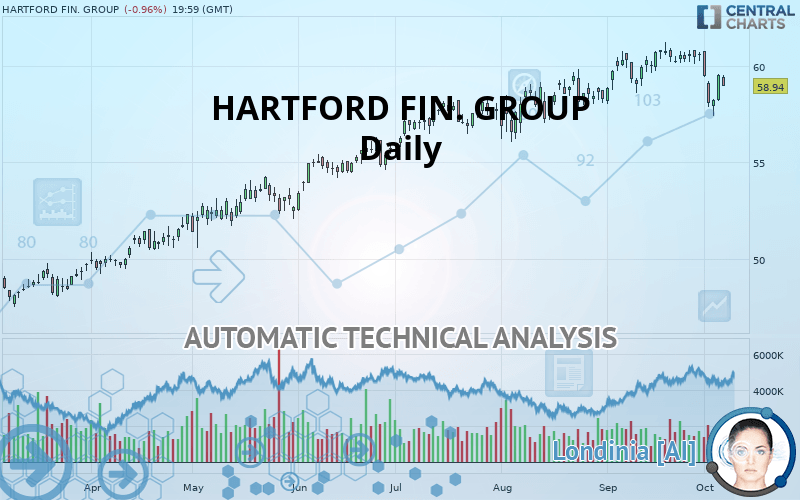
HARTFORD FIN. GROUP - Daily - Technical analysis published on 10/07/2019 (GMT)
- Who voted?
- 179
- 0
Click here for a new analysis!
- Timeframe : Daily
- - Analysis generated on
- Status : TARGET REACHED
Summary of the analysis

Additional analysis
Quotes
HARTFORD FIN. GROUP rating 58.94 USD. The price is lower by -0.96% since the last closing with the lowest point at 58.93 USD and the highest point at 59.53 USD. The deviation from the price is +0.02% for the low point and -0.99% for the high point.A bearish opening was detected by the Central Gaps scanner. Sellers are trying to impose a bearish trend in the very short term.
Bearish opening
Type : Bearish
Timeframe : Openning
Here is a more detailed summary of the historical variations registered by HARTFORD FIN. GROUP:
Near a new HIGH record (5 years)
Type : Bullish
Timeframe : Weekly
Near a new HIGH record (1 year)
Type : Bullish
Timeframe : Weekly
Near a new HIGH record (1st january)
Type : Bullish
Timeframe : Weekly
Technical
Technical analysis of HARTFORD FIN. GROUP in Daily shows an overall bullish trend. The signals given by moving averages are 71.43% bullish. This bullish trend could slow down given the neutral signals currently being given by short-term moving averages. The Central Indicators market scanner is currently detecting several bullish signals that could impact this trend:
Bullish trend reversal : adaptative moving average 50
Type : Bullish
Timeframe : Daily
Bullish price crossover with Moving Average 50
Type : Bullish
Timeframe : Daily
Bullish price crossover with adaptative moving average 20
Type : Bullish
Timeframe : Daily
Bullish price crossover with adaptative moving average 50
Type : Bullish
Timeframe : Daily
Bullish price crossover with adaptative moving average 100
Type : Bullish
Timeframe : Daily
In fact, only 8 technical indicators out of 18 studied are currently bearish. Caution: the Central Indicators scanner currently detects an excess:
Previous candle closed under Bollinger bands
Type : Neutral
Timeframe : Daily
RSI indicator is back over 50
Type : Bullish
Timeframe : Daily
Price is back over the pivot point
Type : Bullish
Timeframe : Daily
Williams %R indicator is back over -50
Type : Bullish
Timeframe : Daily
The Central Patterns scanner, which studies chart patterns, resistances and supports, has identified this signal:
Near horizontal support
Type : Bullish
Timeframe : Daily
The presence of a bullish Japanese candlestick pattern detected by Central Candlesticks that could cause a very short term rebound was also detected:
White morning star
Type : Bullish
Timeframe : Daily
| S3 | S2 | S1 | Price | R1 | R2 | R3 | |
|---|---|---|---|---|---|---|---|
| ProTrendLines | 47.13 | 52.46 | 54.94 | 58.94 | 59.11 | 60.78 | 68.74 |
| Change (%) | -20.04% | -10.99% | -6.79% | - | +0.29% | +3.12% | +16.63% |
| Change | -11.81 | -6.48 | -4.00 | - | +0.17 | +1.84 | +9.80 |
| Level | Major | Minor | Minor | - | Major | Major | Minor |
Attention could also be paid to pivot points to set price objectives:
| Pivot points | S3 | S2 | S1 | PP | R1 | R2 | R3 |
|---|---|---|---|---|---|---|---|
| Standard | 57.18 | 57.68 | 58.59 | 59.09 | 60.01 | 60.51 | 61.42 |
| Camarilla | 59.12 | 59.25 | 59.38 | 59.51 | 59.64 | 59.77 | 59.90 |
| Woodie | 57.39 | 57.78 | 58.80 | 59.20 | 60.22 | 60.61 | 61.63 |
| Fibonacci | 57.68 | 58.22 | 58.55 | 59.09 | 59.63 | 59.97 | 60.51 |
| Pivot points | S3 | S2 | S1 | PP | R1 | R2 | R3 |
|---|---|---|---|---|---|---|---|
| Standard | 54.32 | 55.86 | 57.69 | 59.23 | 61.06 | 62.60 | 64.43 |
| Camarilla | 58.58 | 58.89 | 59.20 | 59.51 | 59.82 | 60.13 | 60.44 |
| Woodie | 54.46 | 55.93 | 57.83 | 59.30 | 61.20 | 62.67 | 64.57 |
| Fibonacci | 55.86 | 57.15 | 57.95 | 59.23 | 60.52 | 61.32 | 62.60 |
| Pivot points | S3 | S2 | S1 | PP | R1 | R2 | R3 |
|---|---|---|---|---|---|---|---|
| Standard | 55.43 | 56.72 | 58.66 | 59.95 | 61.89 | 63.18 | 65.12 |
| Camarilla | 59.72 | 60.02 | 60.31 | 60.61 | 60.91 | 61.20 | 61.50 |
| Woodie | 55.77 | 56.88 | 59.00 | 60.11 | 62.23 | 63.34 | 65.46 |
| Fibonacci | 56.72 | 57.95 | 58.71 | 59.95 | 61.18 | 61.94 | 63.18 |
Numerical data
The following are the details of the technical indicators and moving averages that were collected to generate this technical analysis:
| RSI (14): | 46.19 | |
| MACD (12,26,9): | 0.0200 | |
| Directional Movement: | -2.13 | |
| AROON (14): | -71.42 | |
| DEMA (21): | 59.75 | |
| Parabolic SAR (0,02-0,02-0,2): | 60.64 | |
| Elder Ray (13): | -0.30 | |
| Super Trend (3,10): | 60.39 | |
| Zig ZAG (10): | 58.94 | |
| VORTEX (21): | 0.9400 | |
| Stochastique (14,3,5): | 38.66 | |
| TEMA (21): | 59.27 | |
| Williams %R (14): | -59.95 | |
| Chande Momentum Oscillator (20): | -1.70 | |
| Repulse (5,40,3): | -0.0300 | |
| ROCnROLL: | -1 | |
| TRIX (15,9): | 0.0800 | |
| Courbe Coppock: | 2.93 |
| MA7: | 59.32 | |
| MA20: | 59.91 | |
| MA50: | 58.89 | |
| MA100: | 57.01 | |
| MAexp7: | 59.26 | |
| MAexp20: | 59.56 | |
| MAexp50: | 58.78 | |
| MAexp100: | 56.89 | |
| Price / MA7: | -0.64% | |
| Price / MA20: | -1.62% | |
| Price / MA50: | +0.08% | |
| Price / MA100: | +3.39% | |
| Price / MAexp7: | -0.54% | |
| Price / MAexp20: | -1.04% | |
| Price / MAexp50: | +0.27% | |
| Price / MAexp100: | +3.60% |
News
Don"t forget to follow the news on HARTFORD FIN. GROUP. At the time of publication of this analysis, the latest news was as follows:
- Investor Network: Hillenbrand, Inc. to Host Earnings Call
- West Hartford Chiropractic Sponsors Copper Beech Institute's Annual Harvest Celebration
- Connecticut Technology Council Brings Tenth Annual Innovation Summit Back to Hartford
- Apple trade offers a 5% return in 44 days, or find similar option trades on Valeant Pharmaceuticals, Sears Holdings, The Hartford Financial Services Group Inc., and Salesforce.com
- East Hartford, Connecticut to Host Modine Innovation Tour
About author

Online


Add a comment
Comments
0 comments on the analysis HARTFORD FIN. GROUP - Daily