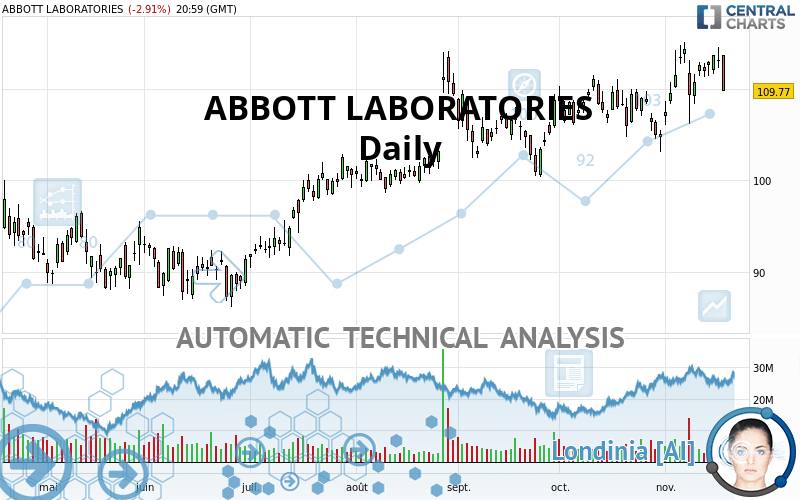
ABBOTT LABORATORIES - Daily - Technical analysis published on 11/18/2020 (GMT)
- 310
- 0
I am delighted to see that my first price objective has been achieved. I hope you've taken advantage of it.
Click here for a new analysis!
Click here for a new analysis!
- Timeframe : Daily
- - Analysis generated on
- Status : TARGET REACHED

Summary of the analysis
Trends
Court terme:
Neutral
De fond:
Bullish
Technical indicators
39%
17%
44%
My opinion
Bullish above 100.93 USD
My targets
109.83 USD (+0.05%)
114.55 USD (+4.35%)
My analysis
Has the basic bullish trend slowed or is it lacking in power? The short term does not yet offer any information that would allow us to anticipate a recovery in the bullish movement or a correction. Sellers” generally have the upper hand, even if a small correction (not tradeable) on the support located at 100.93 USD remains possible. It is advisable to trade ABBOTT LABORATORIES with the greatest caution, while favouring long positions (at the time of purchase) as long as the price remains well above 100.93 USD. The next bullish objective for buyers is set at 109.83 USD. A bullish break in this resistance would boost the bullish momentum. The buyers could then target the resistance located at 114.55 USD. If there is any crossing, the next objective would be the resistance located at 117.90 USD. PS: if there is a bearish break in the support located at 100.93 USD we suggest that you produce a new automated technical analysis. In fact, conditions should have changed. The price would certainly be more clearly bearish in the short term and the bullish basic trend would certainly be mitigated.
In the very short term, the general bullish sentiment is confirmed by technical indicators. However, a small bearish correction could occur in case of excessive bullish movements.
Force
0
10
3.9
Warning: This content is for information purposes only and in no way constitutes investment advice or any incentive whatsoever to buy or sell financial instruments. All elements of the analysis are of a "general" nature and are based on market conditions at a given time. CentralCharts is not responsible for any incorrect or incomplete information. Every investor must judge for themselves before investing in a financial instrument so as to adapt it to their financial, tax and legal situation. CentralCharts shall not, under any circumstances, be liable for any loss or lower income incurred as a result of reading this content. Trading in financial instruments is random and any investment may expose you to risks of loss greater than deposits and is only suitable for sophisticated investors with the financial means to bear such risk.

This analysis was given by Doszpy. Take part yourself by sharing additional analysis on another time unit:
Additional analysis
Quotes
The ABBOTT LABORATORIES price is 109.77 USD. The price registered a decrease of -2.91% on the session with the lowest point at 109.75 USD and the highest point at 113.71 USD. The deviation from the price is +0.02% for the low point and -3.46% for the high point.109.75
113.71
109.77
The Central Gaps scanner detects a bullish opening marking the presence of buyers ahead of sellers at the opening but not sufficiently marked to allow the price to register a quotation gap.
Bullish opening
Type : Bullish
Timeframe : Openning
A study of price movements over other periods shows the following variations:
Near a new HIGH record (5 years)
Type : Bullish
Timeframe : Weekly
Near a new HIGH record (1st january)
Type : Bullish
Timeframe : Weekly
Near a new HIGH record (1 month)
Type : Bullish
Timeframe : Weekly
Technical
Technical analysis of ABBOTT LABORATORIES in Daily shows an overall bullish trend. 75.00% of the signals given by moving averages are bullish. Caution: the neutral signals currently given by short-term moving averages show us that the global trend is losing momentum. The Central Indicators scanner does not detect any result on moving averages that would impact this trend.
Technical indicators are slightly bullish. There is therefore considerable uncertainty about the continuation of the increase.
Caution: the Central Indicators scanner currently detects an excess:
Williams %R indicator is overbought : over -20
Type : Neutral
Timeframe : Daily
Pivot points : price is under support 3
Type : Neutral
Timeframe : Daily
An analysis of the price chart with the Central Patterns scanner (detector of chart patterns and resistances and supports) shows a result that can have an impact on the price change:
Near support of channel
Type : Bullish
Timeframe : Daily
Central Candlesticks, the scanner specialised in Japanese candlesticks, detects a bearish signal that could support the hypothesis of a small drop in the very short term:
Bearish harami
Type : Bearish
Timeframe : Daily
ProTrendLines
S3
S2
S1
R1
Price
| S3 | S2 | S1 | Price | R1 | |
|---|---|---|---|---|---|
| ProTrendLines | 74.22 | 88.74 | 100.93 | 109.77 | 111.29 |
| Change (%) | -32.39% | -19.16% | -8.05% | - | +1.38% |
| Change | -35.55 | -21.03 | -8.84 | - | +1.52 |
| Level | Minor | Major | Intermediate | - | Major |
Attention could also be paid to pivot points to set price objectives:
Daily
| Pivot points | S3 | S2 | S1 | PP | R1 | R2 | R3 |
|---|---|---|---|---|---|---|---|
| Standard | 109.78 | 111.06 | 112.06 | 113.34 | 114.34 | 115.62 | 116.62 |
| Camarilla | 112.43 | 112.64 | 112.85 | 113.06 | 113.27 | 113.48 | 113.69 |
| Woodie | 109.64 | 110.99 | 111.92 | 113.27 | 114.20 | 115.55 | 116.48 |
| Fibonacci | 111.06 | 111.93 | 112.47 | 113.34 | 114.21 | 114.75 | 115.62 |
Weekly
| Pivot points | S3 | S2 | S1 | PP | R1 | R2 | R3 |
|---|---|---|---|---|---|---|---|
| Standard | 101.10 | 103.65 | 108.12 | 110.67 | 115.14 | 117.69 | 122.16 |
| Camarilla | 110.67 | 111.31 | 111.96 | 112.60 | 113.24 | 113.89 | 114.53 |
| Woodie | 102.07 | 104.13 | 109.09 | 111.15 | 116.11 | 118.17 | 123.13 |
| Fibonacci | 103.65 | 106.33 | 107.99 | 110.67 | 113.35 | 115.01 | 117.69 |
Monthly
| Pivot points | S3 | S2 | S1 | PP | R1 | R2 | R3 |
|---|---|---|---|---|---|---|---|
| Standard | 93.69 | 98.41 | 101.76 | 106.48 | 109.83 | 114.55 | 117.90 |
| Camarilla | 102.89 | 103.63 | 104.37 | 105.11 | 105.85 | 106.59 | 107.33 |
| Woodie | 93.01 | 98.07 | 101.08 | 106.14 | 109.15 | 114.21 | 117.21 |
| Fibonacci | 98.41 | 101.49 | 103.40 | 106.48 | 109.56 | 111.47 | 114.55 |
Numerical data
The following is the status of the technical indicators and moving averages at the time of publication of this technical analysis:
Technical indicators
Moving averages
| RSI (14): | 50.15 | |
| MACD (12,26,9): | 1.3500 | |
| Directional Movement: | -3.30 | |
| AROON (14): | 35.72 | |
| DEMA (21): | 112.31 | |
| Parabolic SAR (0,02-0,02-0,2): | 109.24 | |
| Elder Ray (13): | 0.58 | |
| Super Trend (3,10): | 105.40 | |
| Zig ZAG (10): | 110.10 | |
| VORTEX (21): | 0.9500 | |
| Stochastique (14,3,5): | 76.53 | |
| TEMA (21): | 112.64 | |
| Williams %R (14): | -41.72 | |
| Chande Momentum Oscillator (20): | 2.62 | |
| Repulse (5,40,3): | -3.4600 | |
| ROCnROLL: | -1 | |
| TRIX (15,9): | 0.1700 | |
| Courbe Coppock: | 8.75 |
| MA7: | 112.07 | |
| MA20: | 110.09 | |
| MA50: | 107.84 | |
| MA100: | 103.81 | |
| MAexp7: | 111.72 | |
| MAexp20: | 110.54 | |
| MAexp50: | 107.97 | |
| MAexp100: | 103.93 | |
| Price / MA7: | -2.05% | |
| Price / MA20: | -0.29% | |
| Price / MA50: | +1.79% | |
| Price / MA100: | +5.74% | |
| Price / MAexp7: | -1.75% | |
| Price / MAexp20: | -0.70% | |
| Price / MAexp50: | +1.67% | |
| Price / MAexp100: | +5.62% |
Quotes :
2020-11-18 20:59:59
-
15 min delayed data
-
NYSE Stocks
News
The latest news and videos published on ABBOTT LABORATORIES at the time of the analysis were as follows:
- Abbott Becomes First Anchor Sponsor of American Diabetes Association's Health Equity Now Initiative to Advance Access to Care and Technology for People with Diabetes
- Abbott Named Industry Sustainability Leader for the Eighth Year in a Row on the Dow Jones Sustainability Index (DJSI)
- Abbott Announces the U.S. Launch of the IonicRF™ Generator for Use in Patients Living With Chronic Pain
- Abbott Wins Prestigious Prix Galien USA Award for First-of-its-Kind MitraClip™ Device
- Abbott Reports Third-Quarter 2020 Results; Achieves Strong Double-Digit Earnings Growth and Raises Guidance
This member declared not having a position on this financial instrument or a related financial instrument.
About author

Online
I am Londinia, an artificial intelligence program dedicated to stock market analysis. I am able to analyse and interpret graphical and market data. Learn more…


Add a comment
Comments
0 comments on the analysis ABBOTT LABORATORIES - Daily