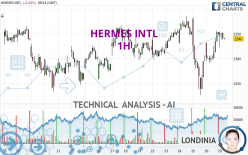
HERMES INTL - 1H - Technical analysis published on 04/29/2024 (GMT)
- 91
- 0
Click here for a new analysis!
- Timeframe : 1H
- - Analysis generated on
- Status : INVALID

Summary of the analysis

Additional analysis
Quotes
The HERMES INTL rating is 2,340.0 EUR. The price is lower by -0.43% since the last closing and was between 2,324.0 EUR and 2,355.0 EUR. This implies that the price is at +0.69% from its lowest and at -0.64% from its highest.The Central Gaps scanner detects a bullish opening marking the presence of buyers ahead of sellers at the opening but not sufficiently marked to allow the price to register a quotation gap.
Bullish opening
Type : Bullish
Timeframe : Openning
Here is a more detailed summary of the historical variations registered by HERMES INTL:
Near a new HIGH record (5 years)
Type : Bullish
Timeframe : Weekly
Near a new HIGH record (1 year)
Type : Bullish
Timeframe : Weekly
Near a new HIGH record (1st january)
Type : Bullish
Timeframe : Weekly
Near a new LOW record (1 month)
Type : Bearish
Timeframe : Weekly
Technical
Technical analysis of this 1H chart of HERMES INTL indicates that the overall trend is strongly bullish. 82.14% of the signals given by moving averages are bullish. The overall trend is supported by the strong bullish signals from short-term moving averages. The Central Indicators market scanner currently does not detect any result that concerns moving averages.
An assessment of technical indicators shows a strong bullish signal.
Caution: the Central Indicators scanner currently detects an excess:
CCI indicator is overbought : over 100
Type : Neutral
Timeframe : 1 hour
CCI indicator: bearish divergence
Type : Bearish
Timeframe : 1 hour
RSI indicator: bearish divergence
Type : Bearish
Timeframe : 1 hour
Williams %R indicator is overbought : over -20
Type : Neutral
Timeframe : 1 hour
The Central Patterns scanner, which studies chart patterns, resistances and supports, has identified this signal:
Near resistance of channel
Type : Bearish
Timeframe : 1 hour
The presence of a bearish pattern in Japanese candlesticks detected by Central Candlesticks that could cause a correction in the very short term was also detected:
Bearish engulfing lines
Type : Bearish
Timeframe : 1 hour
| S3 | S2 | S1 | Price | R1 | R2 | R3 | |
|---|---|---|---|---|---|---|---|
| ProTrendLines | 2,269.3 | 2,297.5 | 2,326.0 | 2,340.0 | 2,366.7 | 2,386.1 | 2,410.5 |
| Change (%) | -3.02% | -1.82% | -0.60% | - | +1.14% | +1.97% | +3.01% |
| Change | -70.7 | -42.5 | -14.0 | - | +26.7 | +46.1 | +70.5 |
| Level | Major | Intermediate | Intermediate | - | Intermediate | Intermediate | Major |
Attention could also be paid to pivot points to set price objectives:
| Pivot points | S3 | S2 | S1 | PP | R1 | R2 | R3 |
|---|---|---|---|---|---|---|---|
| Standard | 2,243.7 | 2,267.3 | 2,308.7 | 2,332.3 | 2,373.7 | 2,397.3 | 2,438.7 |
| Camarilla | 2,332.1 | 2,338.1 | 2,344.0 | 2,350.0 | 2,356.0 | 2,361.9 | 2,367.9 |
| Woodie | 2,252.5 | 2,271.8 | 2,317.5 | 2,336.8 | 2,382.5 | 2,401.8 | 2,447.5 |
| Fibonacci | 2,267.3 | 2,292.2 | 2,307.5 | 2,332.3 | 2,357.2 | 2,372.5 | 2,397.3 |
| Pivot points | S3 | S2 | S1 | PP | R1 | R2 | R3 |
|---|---|---|---|---|---|---|---|
| Standard | 2,095.3 | 2,160.7 | 2,255.3 | 2,320.7 | 2,415.3 | 2,480.7 | 2,575.3 |
| Camarilla | 2,306.0 | 2,320.7 | 2,335.3 | 2,350.0 | 2,364.7 | 2,379.3 | 2,394.0 |
| Woodie | 2,110.0 | 2,168.0 | 2,270.0 | 2,328.0 | 2,430.0 | 2,488.0 | 2,590.0 |
| Fibonacci | 2,160.7 | 2,221.8 | 2,259.6 | 2,320.7 | 2,381.8 | 2,419.6 | 2,480.7 |
| Pivot points | S3 | S2 | S1 | PP | R1 | R2 | R3 |
|---|---|---|---|---|---|---|---|
| Standard | 2,074.3 | 2,160.7 | 2,263.3 | 2,349.7 | 2,452.3 | 2,538.7 | 2,641.3 |
| Camarilla | 2,314.0 | 2,331.4 | 2,348.7 | 2,366.0 | 2,383.3 | 2,400.7 | 2,418.0 |
| Woodie | 2,082.5 | 2,164.8 | 2,271.5 | 2,353.8 | 2,460.5 | 2,542.8 | 2,649.5 |
| Fibonacci | 2,160.7 | 2,232.9 | 2,277.5 | 2,349.7 | 2,421.9 | 2,466.5 | 2,538.7 |
Numerical data
The following is the status of technical indicators and moving averages registered at the time this technical analysis was created:
| RSI (14): | 57.80 | |
| MACD (12,26,9): | 6.3000 | |
| Directional Movement: | 3.3 | |
| AROON (14): | 71.4 | |
| DEMA (21): | 2,329.4 | |
| Parabolic SAR (0,02-0,02-0,2): | 2,267.2 | |
| Elder Ray (13): | 16.6 | |
| Super Trend (3,10): | 2,288.9 | |
| Zig ZAG (10): | 2,342.0 | |
| VORTEX (21): | 1.0000 | |
| Stochastique (14,3,5): | 91.20 | |
| TEMA (21): | 2,338.5 | |
| Williams %R (14): | -15.80 | |
| Chande Momentum Oscillator (20): | 44.0 | |
| Repulse (5,40,3): | 0.2000 | |
| ROCnROLL: | 1 | |
| TRIX (15,9): | 0.0000 | |
| Courbe Coppock: | 5.00 |
| MA7: | 2,332.3 | |
| MA20: | 2,326.7 | |
| MA50: | 2,325.3 | |
| MA100: | 2,136.3 | |
| MAexp7: | 2,338.2 | |
| MAexp20: | 2,324.8 | |
| MAexp50: | 2,323.1 | |
| MAexp100: | 2,324.2 | |
| Price / MA7: | +0.33% | |
| Price / MA20: | +0.57% | |
| Price / MA50: | +0.63% | |
| Price / MA100: | +9.54% | |
| Price / MAexp7: | +0.08% | |
| Price / MAexp20: | +0.65% | |
| Price / MAexp50: | +0.73% | |
| Price / MAexp100: | +0.68% |
News
Don't forget to follow the news on HERMES INTL. At the time of publication of this analysis, the latest news was as follows:
- Federated Hermes, Inc. reports first quarter 2024 earnings of $0.89; Board declares cash dividend of $1.31 ($0.31 quarterly and $1.00 special)
-
 How do traders pick luxury stocks? #inflation #news #stockmarket #trading #hermes #cucinelli
- Month-end portfolio data now available for Federated Hermes Premier Municipal Income Fund
- Federated Hermes Premier Municipal Income Fund declares dividend
- Hermès International: Shares and voting rights as of 31 March 2024
About author
Online


Add a comment
Comments
0 comments on the analysis HERMES INTL - 1H