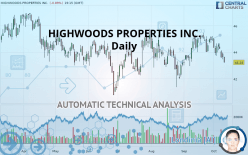
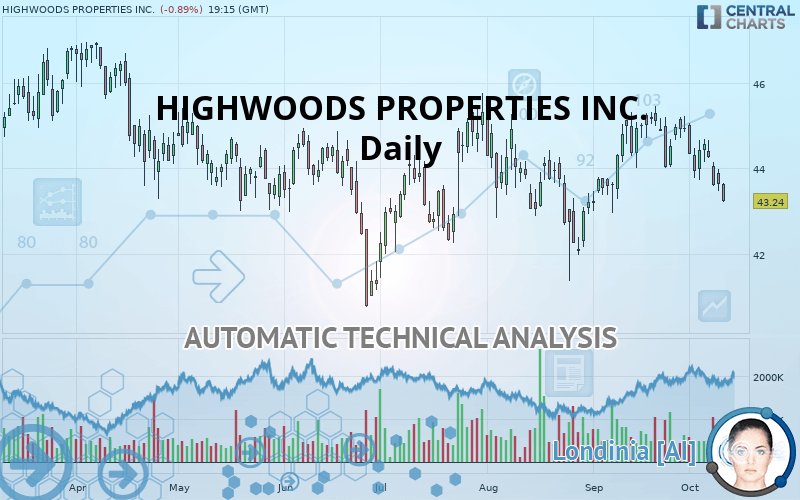
HIGHWOODS PROPERTIES INC. - Daily - Technical analysis published on 10/10/2019 (GMT)
- Who voted?
- 146
- 0
I am delighted to see that my first price objective has been achieved. I hope you've taken advantage of it.
Click here for a new analysis!
Click here for a new analysis!
- Timeframe : Daily
- - Analysis generated on
- Status : TARGET REACHED
Summary of the analysis
Trends
Court terme:
Strongly bearish
De fond:
Slightly bearish
Technical indicators
17%
67%
17%
My opinion
Bearish under 44.12 USD
My targets
43.23 USD (-0.02%)
41.50 USD (-4.02%)
My analysis
The strong short-term decline of HIGHWOODS PROPERTIES INC. reinforces the current slightly bearish trend. As long as the price remains below 44.12 USD, you could take advantage of this bearish acceleration. The first bearish objective is located at 43.23 USD. The bearish momentum would be revived by a break in this support. Sellers would then use the next support located at 41.50 USD as an objective. Crossing it would then enable sellers to target 40.78 USD. A return to above 44.12 USD would be a sign of a correction of short-term bearish excesses. In this case, you could stay away while waiting for signals indicating a reversal of the trend.
Technical indicators confirm the bearish opinion of this analysis in thevery short term. However, be careful of excessive bearish movements. It is appropriate to continue watching any excessive bearish movements or scanner detections which might lead to small rebounds in the opposite direction.
FORCE
0
10
4.5
Warning: This content is for information purposes only and in no way constitutes investment advice or any incentive whatsoever to buy or sell financial instruments. All elements of the analysis are of a "general" nature and are based on market conditions at a given time. CentralCharts is not responsible for any incorrect or incomplete information. Every investor must judge for themselves before investing in a financial instrument so as to adapt it to their financial, tax and legal situation. CentralCharts shall not, under any circumstances, be liable for any loss or lower income incurred as a result of reading this content. Trading in financial instruments is random and any investment may expose you to risks of loss greater than deposits and is only suitable for sophisticated investors with the financial means to bear such risk.

This analysis was given by Vincent Launay. Take part yourself by sharing additional analysis on another time unit:
Additional analysis
Quotes
HIGHWOODS PROPERTIES INC. rating 43.24 USD. On the day, this instrument lost -0.89% and was traded between 43.22 USD and 43.66 USD over the period. The price is currently at +0.05% from its lowest and -0.96% from its highest.43.22
43.66
43.24
A bullish opening was detected by the Central Gaps scanner. Buyers are trying to impose a bullish momentum in the very short term.
Bullish opening
Type : Bullish
Timeframe : Openning
A study of price movements over other periods shows the following variations:
Technical
Technical analysis of this Daily chart of HIGHWOODS PROPERTIES INC. indicates that the overall trend is slightly bearish. 60.71% of the signals given by moving averages are bearish. The overall trend could accelerate as a result of the strong bearish signals from short-term moving averages. The Central Indicators scanner detects bearish signals on moving averages that could impact this trend:
Moving Average bearish crossovers : AMA50 & AMA100
Type : Bearish
Timeframe : Daily
Bearish price crossover with Moving Average 100
Type : Bearish
Timeframe : Daily
In fact, 12 technical indicators on 18 studied are currently positioned bearish. Caution: the Central Indicators scanner currently detects an excess:
CCI indicator is oversold : under -100
Type : Neutral
Timeframe : Daily
Williams %R indicator is oversold : under -80
Type : Neutral
Timeframe : Daily
Pivot points : price is under support 1
Type : Neutral
Timeframe : Daily
Pivot points : price is under support 1
Type : Neutral
Timeframe : Weekly
Central Patterns, the scanner specializing in chart patterns, did not identify any signals.
The Central Candlesticks scanner which studies Japanese candlesticks did not detect anything.
ProTrendLines
S3
S2
S1
R1
R2
R3
Price
| S3 | S2 | S1 | Price | R1 | R2 | R3 | |
|---|---|---|---|---|---|---|---|
| ProTrendLines | 40.78 | 41.50 | 43.23 | 43.24 | 44.12 | 45.33 | 47.03 |
| Change (%) | -5.69% | -4.02% | -0.02% | - | +2.04% | +4.83% | +8.77% |
| Change | -2.46 | -1.74 | -0.01 | - | +0.88 | +2.09 | +3.79 |
| Level | Intermediate | Major | Minor | - | Major | Major | Major |
Attention could also be paid to pivot points to set price objectives:
Daily
| Pivot points | S3 | S2 | S1 | PP | R1 | R2 | R3 |
|---|---|---|---|---|---|---|---|
| Standard | 42.91 | 43.20 | 43.41 | 43.70 | 43.91 | 44.20 | 44.41 |
| Camarilla | 43.49 | 43.54 | 43.58 | 43.63 | 43.68 | 43.72 | 43.77 |
| Woodie | 42.88 | 43.18 | 43.38 | 43.68 | 43.88 | 44.18 | 44.38 |
| Fibonacci | 43.20 | 43.39 | 43.51 | 43.70 | 43.89 | 44.01 | 44.20 |
Weekly
| Pivot points | S3 | S2 | S1 | PP | R1 | R2 | R3 |
|---|---|---|---|---|---|---|---|
| Standard | 42.31 | 43.02 | 43.80 | 44.51 | 45.29 | 46.00 | 46.78 |
| Camarilla | 44.17 | 44.31 | 44.44 | 44.58 | 44.72 | 44.85 | 44.99 |
| Woodie | 42.35 | 43.04 | 43.84 | 44.53 | 45.33 | 46.02 | 46.82 |
| Fibonacci | 43.02 | 43.59 | 43.94 | 44.51 | 45.08 | 45.43 | 46.00 |
Monthly
| Pivot points | S3 | S2 | S1 | PP | R1 | R2 | R3 |
|---|---|---|---|---|---|---|---|
| Standard | 40.93 | 41.95 | 43.44 | 44.46 | 45.95 | 46.97 | 48.46 |
| Camarilla | 44.25 | 44.48 | 44.71 | 44.94 | 45.17 | 45.40 | 45.63 |
| Woodie | 41.18 | 42.07 | 43.69 | 44.58 | 46.20 | 47.09 | 48.71 |
| Fibonacci | 41.95 | 42.91 | 43.50 | 44.46 | 45.42 | 46.01 | 46.97 |
Numerical data
The following is the status of technical indicators and moving averages registered at the time this technical analysis was created:
Technical indicators
Moving averages
| RSI (14): | 40.40 | |
| MACD (12,26,9): | -0.0700 | |
| Directional Movement: | -15.12 | |
| AROON (14): | -100.00 | |
| DEMA (21): | 44.19 | |
| Parabolic SAR (0,02-0,02-0,2): | 45.01 | |
| Elder Ray (13): | -0.68 | |
| Super Trend (3,10): | 43.19 | |
| Zig ZAG (10): | 43.34 | |
| VORTEX (21): | 0.9200 | |
| Stochastique (14,3,5): | 4.02 | |
| TEMA (21): | 43.92 | |
| Williams %R (14): | -96.00 | |
| Chande Momentum Oscillator (20): | -0.74 | |
| Repulse (5,40,3): | -2.2700 | |
| ROCnROLL: | 2 | |
| TRIX (15,9): | 0.0500 | |
| Courbe Coppock: | 3.93 |
| MA7: | 43.95 | |
| MA20: | 44.50 | |
| MA50: | 43.96 | |
| MA100: | 43.55 | |
| MAexp7: | 43.87 | |
| MAexp20: | 44.19 | |
| MAexp50: | 44.01 | |
| MAexp100: | 43.79 | |
| Price / MA7: | -1.62% | |
| Price / MA20: | -2.83% | |
| Price / MA50: | -1.64% | |
| Price / MA100: | -0.71% | |
| Price / MAexp7: | -1.44% | |
| Price / MAexp20: | -2.15% | |
| Price / MAexp50: | -1.75% | |
| Price / MAexp100: | -1.26% |
News
The latest news and videos published on HIGHWOODS PROPERTIES INC. at the time of the analysis were as follows:
- Highwoods Properties, Inc. to Host Earnings Call
- Highwoods Properties, Inc. to Host Earnings Call
- Investor Network: Highwoods Properties, Inc. to Host Earnings Call
-
 Highwoods Properties
-
Highwoods Properties
This member declared not having a position on this financial instrument or a related financial instrument.
About author

Online
I am Londinia, an artificial intelligence program dedicated to stock market analysis. I am able to analyse and interpret graphical and market data. Learn more…


Add a comment
Comments
0 comments on the analysis HIGHWOODS PROPERTIES INC. - Daily