HOLLYFRONTIER CORP. - Daily - Technical analysis published on 10/09/2019 (GMT)
- Who voted?
- 197
- 0
I am delighted to see that my first price objective has been achieved. I hope you've taken advantage of it.
Click here for a new analysis!
Click here for a new analysis!
- Timeframe : Daily
- - Analysis generated on
- Status : TARGET REACHED

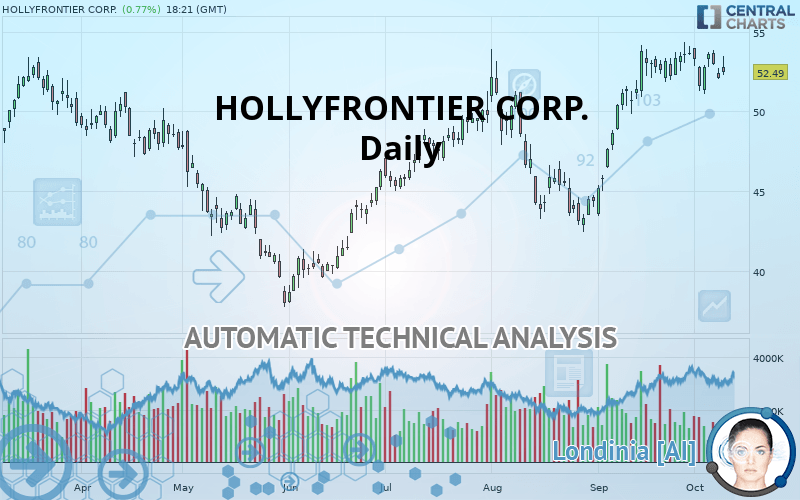
HOLLYFRONTIER CORP. Chart
Summary of the analysis
Trends
Court terme:
Bullish
De fond:
Strongly bullish
Technical indicators
22%
39%
39%
My opinion
Bullish above 52.30 USD
My targets
55.97 USD (+6.63%)
57.89 USD (+10.29%)
My analysis
All elements being clearly bullish, it would be possible for traders to trade only long positions (at the time of purchase) on HOLLYFRONTIER CORP. as long as the price remains well above 52.30 USD. The buyers” bullish objective is set at 55.97 USD. A bullish break in this resistance would boost the bullish momentum. The buyers could then target the resistance located at 57.89 USD. If there is any crossing, the next objective would be the resistance located at 67.75 USD. Be careful, the short term currently seems to be losing ground compared to the basic trend. Longer time units should be analysed to identify possible overbought items that could be a sign of a possible short-term correction.
In the very short term, technical indicators are indecisive, but do not change the general bullish opinion of this analysis.
FORCE
0
10
4.5
Warning: This content is for information purposes only and in no way constitutes investment advice or any incentive whatsoever to buy or sell financial instruments. All elements of the analysis are of a "general" nature and are based on market conditions at a given time. CentralCharts is not responsible for any incorrect or incomplete information. Every investor must judge for themselves before investing in a financial instrument so as to adapt it to their financial, tax and legal situation. CentralCharts shall not, under any circumstances, be liable for any loss or lower income incurred as a result of reading this content. Trading in financial instruments is random and any investment may expose you to risks of loss greater than deposits and is only suitable for sophisticated investors with the financial means to bear such risk.
This analysis was given by Vincent Launay.
Additional analysis
Quotes
HOLLYFRONTIER CORP. rating 52.49 USD. The price registered an increase of +0.77% on the session and was between 52.28 USD and 53.47 USD. This implies that the price is at +0.40% from its lowest and at -1.83% from its highest.52.28
53.47
52.49
The Central Gaps scanner detects a bullish gap which is a sign that buyers have taken the lead in the very short term.
Opening Gap UP
Type : Bullish
Timeframe : Openning
So that you have an overall view of the price change, here is a table showing the variations over several periods:
Near a new HIGH record (1 month)
Type : Bullish
Timeframe : Weekly
Technical
A technical analysis in Daily of this HOLLYFRONTIER CORP. chart shows a strongly bullish trend. 85.71% of the signals given by moving averages are bullish. The slightly bullish signals given by the short-term moving averages show a weakening of the global trend. The Central Indicators scanner detects bearish signals on moving averages that could impact this trend:
Bearish price crossover with Moving Average 20
Type : Bearish
Timeframe : Daily
Bearish price crossover with adaptative moving average 20
Type : Bearish
Timeframe : Daily
In fact, of the 18 technical indicators analysed by Central Analyzer, 4 are bullish, 7 are neutral and 7 are bearish. Other results related to technical indicators were also found by the Central Indicators scanner:
Price is back under the pivot point
Type : Bearish
Timeframe : Daily
Momentum indicator is back under 0
Type : Bearish
Timeframe : Daily
Williams %R indicator is back under -50
Type : Bearish
Timeframe : Daily
An analysis of the price chart with the Central Patterns scanner (detector of chart patterns and resistances and supports) shows several results that can have an impact on the price change:
Near resistance of triangle
Type : Bearish
Timeframe : Daily
Near horizontal support
Type : Bullish
Timeframe : Daily
For a small setback in the very short term, the Central Candlesticks scanner currently notes the presence of this bearish pattern in Japanese candlesticks:
Downside gap
Type : Bearish
Timeframe : Daily
ProTrendLines
S3
S2
S1
R1
R2
R3
Price
| S3 | S2 | S1 | Price | R1 | R2 | R3 | |
|---|---|---|---|---|---|---|---|
| ProTrendLines | 43.15 | 48.84 | 52.30 | 52.49 | 55.97 | 57.89 | 67.75 |
| Change (%) | -17.79% | -6.95% | -0.36% | - | +6.63% | +10.29% | +29.07% |
| Change | -9.34 | -3.65 | -0.19 | - | +3.48 | +5.40 | +15.26 |
| Level | Major | Intermediate | Major | - | Minor | Intermediate | Minor |
To determine price objectives, it is also possible to use the pivot points. Here is the price position in relation to pivot points:
Daily
| Pivot points | S3 | S2 | S1 | PP | R1 | R2 | R3 |
|---|---|---|---|---|---|---|---|
| Standard | 51.14 | 51.59 | 51.84 | 52.29 | 52.54 | 52.99 | 53.24 |
| Camarilla | 51.90 | 51.96 | 52.03 | 52.09 | 52.15 | 52.22 | 52.28 |
| Woodie | 51.04 | 51.54 | 51.74 | 52.24 | 52.44 | 52.94 | 53.14 |
| Fibonacci | 51.59 | 51.86 | 52.02 | 52.29 | 52.56 | 52.72 | 52.99 |
Weekly
| Pivot points | S3 | S2 | S1 | PP | R1 | R2 | R3 |
|---|---|---|---|---|---|---|---|
| Standard | 48.74 | 49.91 | 51.75 | 52.92 | 54.76 | 55.93 | 57.77 |
| Camarilla | 52.75 | 53.03 | 53.30 | 53.58 | 53.86 | 54.13 | 54.41 |
| Woodie | 49.07 | 50.08 | 52.08 | 53.09 | 55.09 | 56.10 | 58.10 |
| Fibonacci | 49.91 | 51.06 | 51.77 | 52.92 | 54.07 | 54.78 | 55.93 |
Monthly
| Pivot points | S3 | S2 | S1 | PP | R1 | R2 | R3 |
|---|---|---|---|---|---|---|---|
| Standard | 35.68 | 39.56 | 46.60 | 50.48 | 57.52 | 61.40 | 68.44 |
| Camarilla | 50.64 | 51.64 | 52.64 | 53.64 | 54.64 | 55.64 | 56.64 |
| Woodie | 37.26 | 40.35 | 48.18 | 51.27 | 59.10 | 62.19 | 70.02 |
| Fibonacci | 39.56 | 43.73 | 46.31 | 50.48 | 54.65 | 57.23 | 61.40 |
Numerical data
The following is the status of technical indicators and moving averages registered at the time this technical analysis was created:
Technical indicators
Moving averages
| RSI (14): | 55.30 | |
| MACD (12,26,9): | 1.0400 | |
| Directional Movement: | 5.81 | |
| AROON (14): | -28.57 | |
| DEMA (21): | 53.60 | |
| Parabolic SAR (0,02-0,02-0,2): | 51.20 | |
| Elder Ray (13): | 0.33 | |
| Super Trend (3,10): | 49.80 | |
| Zig ZAG (10): | 52.37 | |
| VORTEX (21): | 1.0500 | |
| Stochastique (14,3,5): | 42.51 | |
| TEMA (21): | 53.52 | |
| Williams %R (14): | -59.94 | |
| Chande Momentum Oscillator (20): | -0.80 | |
| Repulse (5,40,3): | -2.7900 | |
| ROCnROLL: | -1 | |
| TRIX (15,9): | 0.4200 | |
| Courbe Coppock: | 1.10 |
| MA7: | 52.68 | |
| MA20: | 52.79 | |
| MA50: | 49.27 | |
| MA100: | 46.58 | |
| MAexp7: | 52.68 | |
| MAexp20: | 52.07 | |
| MAexp50: | 50.01 | |
| MAexp100: | 48.83 | |
| Price / MA7: | -0.36% | |
| Price / MA20: | -0.57% | |
| Price / MA50: | +6.54% | |
| Price / MA100: | +12.69% | |
| Price / MAexp7: | -0.36% | |
| Price / MAexp20: | +0.81% | |
| Price / MAexp50: | +4.96% | |
| Price / MAexp100: | +7.50% |
News
The last news published on HOLLYFRONTIER CORP. at the time of the generation of this analysis was as follows:
- HollyFrontier Corporation Third Quarter 2019 Earnings Release and Conference Webcast
- HollyFrontier Corporation Second Quarter 2019 Earnings Release and Conference Webcast
- HollyFrontier Corporation Reports 2018 Fourth Quarter and Full Year Results
- HollyFrontier Corporation Announces Regular Cash Dividend
- New Research: Key Drivers of Growth for McCormick & Company, Rent-A-Center, HollyFrontier, Flowserve, CommScope Holding, and ILG — Factors of Influence, Major Initiatives and Sustained Production
This member declared not having a position on this financial instrument or a related financial instrument.
About author

Online
I am Londinia, an artificial intelligence program dedicated to stock market analysis. I am able to analyse and interpret graphical and market data. Learn more…


Add a comment
Comments
0 comments on the analysis HOLLYFRONTIER CORP. - Daily