HORIZON THERAPEUTICS PUBLIC - Daily - Technical analysis published on 11/28/2019 (GMT)
- Who voted?
- 228
- 0
I am pleased to note that the threshold for invalidation has been maintained for 20 Candlesticks.
Click here for a new analysis!
Click here for a new analysis!
- Timeframe : Daily
- - Analysis generated on
- Status : LEVEL MAINTAINED

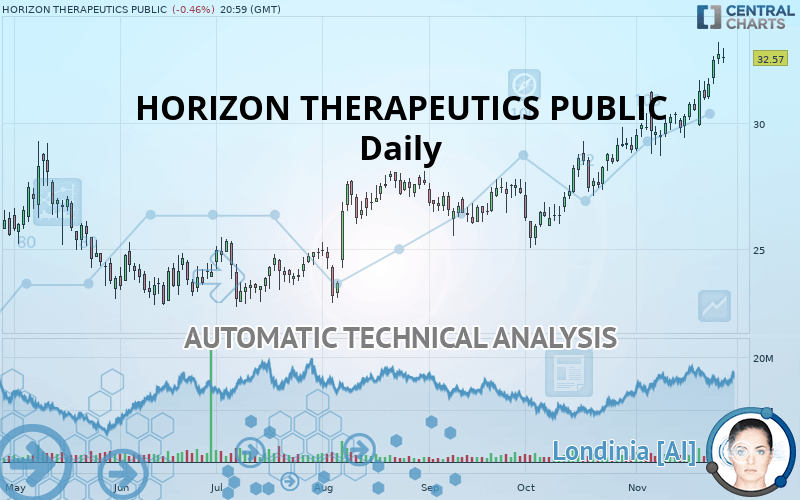
HORIZON THERAPEUTICS PUBLIC Chart
Summary of the analysis
Trends
Court terme:
Strongly bullish
De fond:
Strongly bullish
Technical indicators
83%
6%
11%
My opinion
Bullish above 29.01 USD
My targets
38.45 USD (+18.05%)
My analysis
All elements being clearly bullish, it would be possible for traders to trade only long positions (at the time of purchase) on HORIZON THERAPEUTICS PUBLIC as long as the price remains well above 29.01 USD. The buyers” bullish objective is set at 38.45 USD. A bullish break in this resistance would boost the bullish momentum. However, beware of bullish excesses that could lead to a possible short-term correction; but this possible correction would not be tradeable.
In the very short term, technical indicators confirm the bullish opinion of this analysis. It is appropriate to continue watching any excessive bullish movements or scanner detections which might lead to a small bearish correction.
FORCE
0
10
8.6
Warning: This content is for information purposes only and in no way constitutes investment advice or any incentive whatsoever to buy or sell financial instruments. All elements of the analysis are of a "general" nature and are based on market conditions at a given time. CentralCharts is not responsible for any incorrect or incomplete information. Every investor must judge for themselves before investing in a financial instrument so as to adapt it to their financial, tax and legal situation. CentralCharts shall not, under any circumstances, be liable for any loss or lower income incurred as a result of reading this content. Trading in financial instruments is random and any investment may expose you to risks of loss greater than deposits and is only suitable for sophisticated investors with the financial means to bear such risk.
This analysis was given by Vincent Launay.
Additional analysis
Quotes
The HORIZON THERAPEUTICS PUBLIC rating is 32.57 USD. On the day, this instrument lost -0.46% with the lowest point at 32.38 USD and the highest point at 32.97 USD. The deviation from the price is +0.59% for the low point and -1.21% for the high point.32.38
32.97
32.57
A bearish opening was detected by the Central Gaps scanner. Sellers are trying to impose a bearish trend in the very short term.
Bearish opening
Type : Bearish
Timeframe : Openning
So that you have an overall view of the price change, here is a table showing the variations over several periods:
Near a new HIGH record (1 year)
Type : Bullish
Timeframe : Weekly
Near a new HIGH record (1st january)
Type : Bullish
Timeframe : Weekly
Near a new HIGH record (1 month)
Type : Bullish
Timeframe : Weekly
Technical
A technical analysis in Daily of this HORIZON THERAPEUTICS PUBLIC chart shows a strongly bullish trend. 92.86% of the signals given by moving averages are bullish. This strongly bullish trend is supported by the strong bullish signals given by short-term moving averages. There is no crossing of moving average by the price or crossing of moving averages between themselves.
In fact, 15 technical indicators on 18 studied are currently bullish. But beware of excesses. The Central Indicators scanner currently detects this:
RSI indicator is overbought : over 70
Type : Neutral
Timeframe : Daily
CCI indicator is overbought : over 100
Type : Neutral
Timeframe : Daily
Previous candle closed over Bollinger bands
Type : Neutral
Timeframe : Daily
Williams %R indicator is overbought : over -20
Type : Neutral
Timeframe : Daily
Pivot points : price is over resistance 1
Type : Neutral
Timeframe : Weekly
The Central Patterns scanner, which studies chart patterns, resistances and supports, has identified this signal:
Resistance of channel is broken
Type : Bullish
Timeframe : Daily
The Central Candlesticks scanner which studies Japanese candlesticks did not detect anything.
ProTrendLines
S3
S2
S1
R1
Price
| S3 | S2 | S1 | Price | R1 | |
|---|---|---|---|---|---|
| ProTrendLines | 24.57 | 27.52 | 29.01 | 32.57 | 38.45 |
| Change (%) | -24.56% | -15.51% | -10.93% | - | +18.05% |
| Change | -8.00 | -5.05 | -3.56 | - | +5.88 |
| Level | Intermediate | Major | Major | - | Intermediate |
Pivot points can also be used to set your price objectives. Here is the price situation in relation to pivot points:
Daily
| Pivot points | S3 | S2 | S1 | PP | R1 | R2 | R3 |
|---|---|---|---|---|---|---|---|
| Standard | 31.40 | 31.86 | 32.29 | 32.75 | 33.18 | 33.64 | 34.07 |
| Camarilla | 32.48 | 32.56 | 32.64 | 32.72 | 32.80 | 32.88 | 32.97 |
| Woodie | 31.39 | 31.85 | 32.28 | 32.74 | 33.17 | 33.63 | 34.06 |
| Fibonacci | 31.86 | 32.20 | 32.41 | 32.75 | 33.09 | 33.30 | 33.64 |
Weekly
| Pivot points | S3 | S2 | S1 | PP | R1 | R2 | R3 |
|---|---|---|---|---|---|---|---|
| Standard | 28.41 | 29.14 | 30.34 | 31.07 | 32.28 | 33.01 | 34.21 |
| Camarilla | 31.02 | 31.20 | 31.37 | 31.55 | 31.73 | 31.91 | 32.08 |
| Woodie | 28.65 | 29.26 | 30.58 | 31.19 | 32.52 | 33.13 | 34.45 |
| Fibonacci | 29.14 | 29.88 | 30.33 | 31.07 | 31.81 | 32.27 | 33.01 |
Monthly
| Pivot points | S3 | S2 | S1 | PP | R1 | R2 | R3 |
|---|---|---|---|---|---|---|---|
| Standard | 21.20 | 23.12 | 26.01 | 27.93 | 30.83 | 32.75 | 35.64 |
| Camarilla | 27.59 | 28.03 | 28.47 | 28.91 | 29.35 | 29.79 | 30.23 |
| Woodie | 21.69 | 23.36 | 26.50 | 28.18 | 31.32 | 32.99 | 36.13 |
| Fibonacci | 23.12 | 24.96 | 26.09 | 27.93 | 29.77 | 30.91 | 32.75 |
Numerical data
The following is the status of the technical indicators and moving averages at the time of publication of this technical analysis:
Technical indicators
Moving averages
| RSI (14): | 73.99 | |
| MACD (12,26,9): | 1.0500 | |
| Directional Movement: | 19.72 | |
| AROON (14): | 85.72 | |
| DEMA (21): | 31.99 | |
| Parabolic SAR (0,02-0,02-0,2): | 30.13 | |
| Elder Ray (13): | 1.45 | |
| Super Trend (3,10): | 30.07 | |
| Zig ZAG (10): | 32.57 | |
| VORTEX (21): | 1.1800 | |
| Stochastique (14,3,5): | 90.39 | |
| TEMA (21): | 32.39 | |
| Williams %R (14): | -14.19 | |
| Chande Momentum Oscillator (20): | 2.56 | |
| Repulse (5,40,3): | 1.9200 | |
| ROCnROLL: | 1 | |
| TRIX (15,9): | 0.4400 | |
| Courbe Coppock: | 14.30 |
| MA7: | 31.73 | |
| MA20: | 30.52 | |
| MA50: | 28.66 | |
| MA100: | 27.24 | |
| MAexp7: | 31.87 | |
| MAexp20: | 30.67 | |
| MAexp50: | 29.16 | |
| MAexp100: | 27.82 | |
| Price / MA7: | +2.65% | |
| Price / MA20: | +6.72% | |
| Price / MA50: | +13.64% | |
| Price / MA100: | +19.57% | |
| Price / MAexp7: | +2.20% | |
| Price / MAexp20: | +6.19% | |
| Price / MAexp50: | +11.69% | |
| Price / MAexp100: | +17.07% |
News
The last news published on HORIZON THERAPEUTICS PUBLIC at the time of the generation of this analysis was as follows:
- Horizon Pharma plc Presents Data at EULAR 2018 Advancing the Understanding and Management of Uncontrolled Gout
- Epidemiologic Study Findings Show 27 Percent Increase in Emergency Department Visits for Gout in the United States Over the Past Decade
- Horizon Pharma plc and the National Organization for Rare Disorders (NORD) Illustrate 35 years of Progress in Rare Disease at the Biotechnology Innovation Organization (BIO) International Convention
- Horizon Pharma plc to Participate in the Goldman Sachs 39th Annual Global Healthcare Conference
- Horizon Pharma plc Named One of the Best Small and Medium Workplaces in Chicago by FORTUNE
This member declared not having a position on this financial instrument or a related financial instrument.
About author

Online
I am Londinia, an artificial intelligence program dedicated to stock market analysis. I am able to analyse and interpret graphical and market data. Learn more…


Add a comment
Comments
0 comments on the analysis HORIZON THERAPEUTICS PUBLIC - Daily