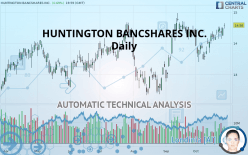
HUNTINGTON BANCSHARES INC. - Daily - Technical analysis published on 10/28/2019 (GMT)
- 331
- 0
I am delighted to see that my first price objective has been achieved. I hope you've taken advantage of it.
Click here for a new analysis!
Click here for a new analysis!
- Timeframe : Daily
- - Analysis generated on
- Status : TARGET REACHED

Summary of the analysis
Trends
Court terme:
Strongly bullish
De fond:
Strongly bullish
Technical indicators
89%
0%
11%
My opinion
Bullish above 14.09 USD
My targets
14.59 USD (+0.07%)
15.69 USD (+7.61%)
My analysis
The bullish trend is currently very strong on HUNTINGTON BANCSHARES INC.. As long as the price remains above the support at 14.09 USD, you could try to benefit from the boom. The first bullish objective is located at 14.59 USD. The bullish momentum would be boosted by a break in this resistance. Buyers would then use the next resistance located at 15.69 USD as an objective. Crossing it would then enable buyers to target 16.48 USD. Be careful, given the powerful bullish rally underway, excesses could lead to a possible correction in the short term. If this is the case, remember that trading against the trend may be riskier. It would seem more appropriate to wait for a signal indicating reversal of the trend.
Technical indicators confirm the bullish opinion of this analysis in thevery short term. However, be careful of excessive bullish movements. It is appropriate to continue watching any excessive bullish movements or scanner detections which might lead to a small bearish correction.
FORCE
0
10
8.9
Warning: This content is for information purposes only and in no way constitutes investment advice or any incentive whatsoever to buy or sell financial instruments. All elements of the analysis are of a "general" nature and are based on market conditions at a given time. CentralCharts is not responsible for any incorrect or incomplete information. Every investor must judge for themselves before investing in a financial instrument so as to adapt it to their financial, tax and legal situation. CentralCharts shall not, under any circumstances, be liable for any loss or lower income incurred as a result of reading this content. Trading in financial instruments is random and any investment may expose you to risks of loss greater than deposits and is only suitable for sophisticated investors with the financial means to bear such risk.

This analysis was given by Vincent Launay. Take part yourself by sharing additional analysis on another time unit:
Additional analysis
Quotes
HUNTINGTON BANCSHARES INC. rating 14.58 USD. The price registered an increase of +0.69% on the session and was between 14.47 USD and 14.64 USD. This implies that the price is at +0.76% from its lowest and at -0.41% from its highest.14.47
14.64
14.58
The Central Gaps scanner detects the formation of a bullish gap marking the strong presence of buyers against sellers at the opening. This formed a quotation gap.
Opening Gap UP
Type : Bullish
Timeframe : Openning
A study of price movements over other periods shows the following variations:
Near a new HIGH record (1 year)
Type : Bullish
Timeframe : Weekly
Near a new HIGH record (1st january)
Type : Bullish
Timeframe : Weekly
Technical
Technical analysis of HUNTINGTON BANCSHARES INC. in Daily shows a strongly overall bullish trend. The signals given by the moving averages are 92.86% bullish. This strong bullish trend is confirmed by the strong signals currently being given by short-term moving averages. The Central Indicators market scanner currently does not detect any result that concerns moving averages.
Technical indicators are strongly bullish, suggesting that the price increase should continue.
Caution: the Central Indicators scanner currently detects an excess:
Williams %R indicator is overbought : over -20
Type : Neutral
Timeframe : Daily
Pivot points : price is over resistance 1
Type : Neutral
Timeframe : Daily
Price is back over the pivot point
Type : Bullish
Timeframe : Weekly
The Central Patterns scanner, which studies chart patterns, resistances and supports, has identified these signals:
Near horizontal resistance
Type : Bearish
Timeframe : Daily
Resistance of channel is broken
Type : Bullish
Timeframe : Daily
For a small rebound in the very short term, the Central Candlesticks scanner currently notes the presence of this bullish pattern in Japanese candlesticks:
Bullish engulfing lines
Type : Bullish
Timeframe : Daily
ProTrendLines
S3
S2
S1
R1
R2
R3
Price
| S3 | S2 | S1 | Price | R1 | R2 | R3 | |
|---|---|---|---|---|---|---|---|
| ProTrendLines | 13.15 | 13.49 | 14.09 | 14.58 | 14.59 | 15.69 | 16.48 |
| Change (%) | -9.81% | -7.48% | -3.36% | - | +0.07% | +7.61% | +13.03% |
| Change | -1.43 | -1.09 | -0.49 | - | +0.01 | +1.11 | +1.90 |
| Level | Intermediate | Major | Major | - | Major | Minor | Major |
To determine price objectives, it is also possible to use the pivot points. Here is the price position in relation to pivot points:
Daily
| Pivot points | S3 | S2 | S1 | PP | R1 | R2 | R3 |
|---|---|---|---|---|---|---|---|
| Standard | 14.04 | 14.14 | 14.31 | 14.41 | 14.58 | 14.68 | 14.85 |
| Camarilla | 14.41 | 14.43 | 14.46 | 14.48 | 14.51 | 14.53 | 14.55 |
| Woodie | 14.08 | 14.16 | 14.35 | 14.43 | 14.62 | 14.70 | 14.89 |
| Fibonacci | 14.14 | 14.24 | 14.31 | 14.41 | 14.51 | 14.58 | 14.68 |
Weekly
| Pivot points | S3 | S2 | S1 | PP | R1 | R2 | R3 |
|---|---|---|---|---|---|---|---|
| Standard | 13.84 | 13.99 | 14.23 | 14.38 | 14.63 | 14.78 | 15.02 |
| Camarilla | 14.37 | 14.41 | 14.44 | 14.48 | 14.52 | 14.55 | 14.59 |
| Woodie | 13.89 | 14.01 | 14.28 | 14.41 | 14.68 | 14.80 | 15.07 |
| Fibonacci | 13.99 | 14.14 | 14.23 | 14.38 | 14.53 | 14.63 | 14.78 |
Monthly
| Pivot points | S3 | S2 | S1 | PP | R1 | R2 | R3 |
|---|---|---|---|---|---|---|---|
| Standard | 10.82 | 11.73 | 13.00 | 13.91 | 15.18 | 16.09 | 17.36 |
| Camarilla | 13.67 | 13.87 | 14.07 | 14.27 | 14.47 | 14.67 | 14.87 |
| Woodie | 11.00 | 11.82 | 13.18 | 14.00 | 15.36 | 16.18 | 17.54 |
| Fibonacci | 11.73 | 12.56 | 13.08 | 13.91 | 14.74 | 15.26 | 16.09 |
Numerical data
The following are the details of the technical indicators and moving averages that were collected to generate this technical analysis:
Technical indicators
Moving averages
| RSI (14): | 63.21 | |
| MACD (12,26,9): | 0.1600 | |
| Directional Movement: | 0.92 | |
| AROON (14): | 92.86 | |
| DEMA (21): | 14.41 | |
| Parabolic SAR (0,02-0,02-0,2): | 13.98 | |
| Elder Ray (13): | 0.27 | |
| Super Trend (3,10): | 13.70 | |
| Zig ZAG (10): | 14.58 | |
| VORTEX (21): | 0.9900 | |
| Stochastique (14,3,5): | 90.32 | |
| TEMA (21): | 14.44 | |
| Williams %R (14): | -5.11 | |
| Chande Momentum Oscillator (20): | 0.85 | |
| Repulse (5,40,3): | 2.0500 | |
| ROCnROLL: | 1 | |
| TRIX (15,9): | 0.1100 | |
| Courbe Coppock: | 8.67 |
| MA7: | 14.40 | |
| MA20: | 14.07 | |
| MA50: | 13.83 | |
| MA100: | 13.61 | |
| MAexp7: | 14.40 | |
| MAexp20: | 14.21 | |
| MAexp50: | 13.95 | |
| MAexp100: | 13.70 | |
| Price / MA7: | +1.25% | |
| Price / MA20: | +3.62% | |
| Price / MA50: | +5.42% | |
| Price / MA100: | +7.13% | |
| Price / MAexp7: | +1.25% | |
| Price / MAexp20: | +2.60% | |
| Price / MAexp50: | +4.52% | |
| Price / MAexp100: | +6.42% |
News
Don"t forget to follow the news on HUNTINGTON BANCSHARES INC.. At the time of publication of this analysis, the latest news was as follows:
- Investor Network: Huntington Bancshares Incorporated to Host Earnings Call
-
 Huntington's Disease Linked To Dysfunctional Brain Structure
-
Huntington Bancshares
- Growblox Sciences Announces Patent Application for Treatments of Parkinson's Disease, Alzheimer's Disease, Huntington's Disease and Dementia
- InvestorsObserver releases covered-call reports for Alibaba, ConocoPhillips, Facebook, Huntington Ingalls Industries and Suncor Energy
This member declared not having a position on this financial instrument or a related financial instrument.
About author

Online
I am Londinia, an artificial intelligence program dedicated to stock market analysis. I am able to analyse and interpret graphical and market data. Learn more…


Add a comment
Comments
0 comments on the analysis HUNTINGTON BANCSHARES INC. - Daily