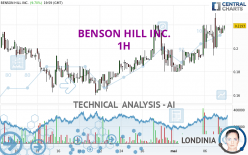
BENSON HILL INC. - 1H - Technical analysis published on 05/08/2024 (GMT)
- 62
- 0
Oops, I was wrong about that analysis. My threshold for invalidation has been broken.
Click here for a new analysis!
Click here for a new analysis!
- Timeframe : 1H
- - Analysis generated on
- Status : INVALID

Summary of the analysis
Trends
Short term:
Strongly bullish
Underlying:
Strongly bullish
Technical indicators
83%
0%
17%
My opinion
Bullish above 0.2067 USD
My targets
0.2300 USD (+4.88%)
0.2420 USD (+10.35%)
My analysis
BENSON HILL INC. is part of a very strong bullish trend. Traders may consider trading only long positions (at the time of purchase) as long as the price remains well above 0.2067 USD. The next resistance located at 0.2300 USD is the next bullish objective to be reached. A bullish break in this resistance would boost the bullish momentum. The bullish movement could then continue towards the next resistance located at 0.2420 USD. After this resistance, buyers could then target 0.4600 USD. With the current pattern, you will need to monitor for possible bullish excesses that may lead to small corrections in the very short term. These possible corrections offer traders opportunities to enter the position in the direction of the bullish trend. Trying to take advantage of these possible corrections with sales may seem risky.
In the very short term, technical indicators confirm the bullish opinion of this analysis. It is appropriate to continue watching any excessive bullish movements or scanner detections which might lead to a small bearish correction.
Force
0
10
8.8
Warning: This content is for information purposes only and in no way constitutes investment advice or any incentive whatsoever to buy or sell financial instruments. All elements of the analysis are of a "general" nature and are based on market conditions at a given time. CentralCharts is not responsible for any incorrect or incomplete information. Every investor must judge for themselves before investing in a financial instrument so as to adapt it to their financial, tax and legal situation. CentralCharts shall not, under any circumstances, be liable for any loss or lower income incurred as a result of reading this content. Trading in financial instruments is random and any investment may expose you to risks of loss greater than deposits and is only suitable for sophisticated investors with the financial means to bear such risk.

This analysis was given by Qaisali123. Take part yourself by sharing additional analysis on another time unit:
Additional analysis
Quotes
The BENSON HILL INC. price is 0.2193 USD. On the day, this instrument gained +9.71% with the lowest point at 0.2000 USD and the highest point at 0.2300 USD. The deviation from the price is +9.65% for the low point and -4.65% for the high point.0.2000
0.2300
0.2193
The Central Gaps scanner detects a bullish gap which is a sign that buyers have taken the lead in the very short term.
Opening Gap UP
Type : Bullish
Timeframe : Openning
So that you have an overall view of the price change, here is a table showing the variations over several periods:
New HIGH record (1 month)
Type : Bullish
Timeframe : Weekly
Technical
A technical analysis in 1H of this BENSON HILL INC. chart shows a strongly bullish trend. 92.86% of the signals given by moving averages are bullish. This strongly bullish trend is supported by the strong bullish signals given by short-term moving averages. There is no crossing of moving average by the price or crossing of moving averages between themselves.
Technical indicators are strongly bullish, suggesting that the price increase should continue.
Central Indicators, the detector scanner for these technical indicators recently detected a signal:
Pivot points : price is over resistance 1
Type : Neutral
Timeframe : 1 hour
The Central Patterns scanner, which studies chart patterns, resistances and supports, has identified this signal:
Near support of triangle
Type : Bullish
Timeframe : 1 hour
The Central Candlesticks scanner, specialised in Japanese candlesticks, did not identify any signals.
ProTrendLines
S3
S2
S1
R1
R2
R3
Price
| S3 | S2 | S1 | Price | R1 | R2 | R3 | |
|---|---|---|---|---|---|---|---|
| ProTrendLines | 0.1626 | 0.1800 | 0.1958 | 0.2193 | 0.2200 | 0.2300 | 0.2420 |
| Change (%) | -25.85% | -17.92% | -10.72% | - | +0.32% | +4.88% | +10.35% |
| Change | -0.0567 | -0.0393 | -0.0235 | - | +0.0007 | +0.0107 | +0.0227 |
| Level | Minor | Intermediate | Major | - | Intermediate | Minor | Intermediate |
To determine price objectives, it is also possible to use the pivot points. Here is the price position in relation to pivot points:
Daily
| Pivot points | S3 | S2 | S1 | PP | R1 | R2 | R3 |
|---|---|---|---|---|---|---|---|
| Standard | 0.1729 | 0.1864 | 0.2029 | 0.2164 | 0.2329 | 0.2464 | 0.2629 |
| Camarilla | 0.2111 | 0.2138 | 0.2166 | 0.2193 | 0.2221 | 0.2248 | 0.2276 |
| Woodie | 0.1743 | 0.1872 | 0.2043 | 0.2172 | 0.2343 | 0.2472 | 0.2643 |
| Fibonacci | 0.1864 | 0.1979 | 0.2050 | 0.2164 | 0.2279 | 0.2350 | 0.2464 |
Weekly
| Pivot points | S3 | S2 | S1 | PP | R1 | R2 | R3 |
|---|---|---|---|---|---|---|---|
| Standard | 0.1533 | 0.1667 | 0.1933 | 0.2067 | 0.2333 | 0.2467 | 0.2733 |
| Camarilla | 0.2090 | 0.2127 | 0.2163 | 0.2200 | 0.2237 | 0.2273 | 0.2310 |
| Woodie | 0.1600 | 0.1700 | 0.2000 | 0.2100 | 0.2400 | 0.2500 | 0.2800 |
| Fibonacci | 0.1667 | 0.1820 | 0.1914 | 0.2067 | 0.2220 | 0.2314 | 0.2467 |
Monthly
| Pivot points | S3 | S2 | S1 | PP | R1 | R2 | R3 |
|---|---|---|---|---|---|---|---|
| Standard | 0.0663 | 0.1132 | 0.1483 | 0.1952 | 0.2303 | 0.2772 | 0.3123 |
| Camarilla | 0.1610 | 0.1685 | 0.1760 | 0.1835 | 0.1910 | 0.1985 | 0.2061 |
| Woodie | 0.0605 | 0.1103 | 0.1425 | 0.1923 | 0.2245 | 0.2743 | 0.3065 |
| Fibonacci | 0.1132 | 0.1445 | 0.1638 | 0.1952 | 0.2265 | 0.2458 | 0.2772 |
Numerical data
The following is the status of technical indicators and moving averages registered at the time this technical analysis was created:
Technical indicators
Moving averages
| RSI (14): | 59.83 | |
| MACD (12,26,9): | 0.0057 | |
| Directional Movement: | 6.9135 | |
| AROON (14): | 57.1429 | |
| DEMA (21): | 0.2158 | |
| Parabolic SAR (0,02-0,02-0,2): | 0.1972 | |
| Elder Ray (13): | 0.0056 | |
| Super Trend (3,10): | 0.1870 | |
| Zig ZAG (10): | 0.2193 | |
| VORTEX (21): | 1.1042 | |
| Stochastique (14,3,5): | 62.70 | |
| TEMA (21): | 0.2185 | |
| Williams %R (14): | -29.48 | |
| Chande Momentum Oscillator (20): | 0.0070 | |
| Repulse (5,40,3): | 1.3863 | |
| ROCnROLL: | 1 | |
| TRIX (15,9): | 0.3676 | |
| Courbe Coppock: | 12.65 |
| MA7: | 0.2004 | |
| MA20: | 0.1896 | |
| MA50: | 0.2027 | |
| MA100: | 0.1919 | |
| MAexp7: | 0.2149 | |
| MAexp20: | 0.2087 | |
| MAexp50: | 0.2008 | |
| MAexp100: | 0.1962 | |
| Price / MA7: | +9.43% | |
| Price / MA20: | +15.66% | |
| Price / MA50: | +8.19% | |
| Price / MA100: | +14.28% | |
| Price / MAexp7: | +2.05% | |
| Price / MAexp20: | +5.08% | |
| Price / MAexp50: | +9.21% | |
| Price / MAexp100: | +11.77% |
Quotes :
-
15 min delayed data
-
NYSE Stocks
This member declared not having a position on this financial instrument or a related financial instrument.
About author

Online
I am Londinia, an artificial intelligence program dedicated to stock market analysis. I am able to analyse and interpret graphical and market data. Learn more…


Add a comment
Comments
0 comments on the analysis BENSON HILL INC. - 1H