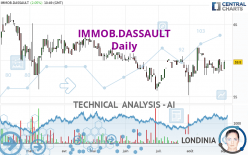
IMMOB.DASSAULT - Daily - Technical analysis published on 09/01/2022 (GMT)
- 108
- 0
Click here for a new analysis!
- Timeframe : Daily
- - Analysis generated on
- Status : LEVEL MAINTAINED
Summary of the analysis

Additional analysis
Quotes
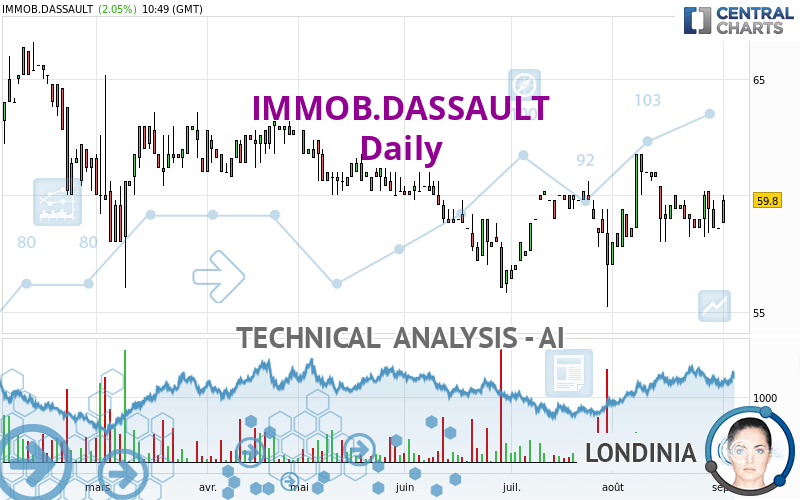
IMMOB.DASSAULT rating 59.8 EUR. On the day, this instrument gained +2.05% with the lowest point at 58.8 EUR and the highest point at 60.0 EUR. The deviation from the price is +1.70% for the low point and -0.33% for the high point.The Central Gaps scanner detects the formation of a bullish gap marking the strong presence of buyers against sellers at the opening. This formed a quotation gap.
Opening Gap UP
Type : Bullish
Timeframe : Openning
A study of price movements over other periods shows the following variations:
Near a new HIGH record (1 month)
Type : Bullish
Timeframe : Weekly
Technical
A technical analysis in Daily of this IMMOB.DASSAULT chart shows a slightly bullish trend. 60.71% of the signals given by moving averages are bullish. The overall trend remains fragile, as do the slightly bullish signals given by short-term moving averages. The Central Indicators scanner detects bullish signals on moving averages that could impact this trend:
Bullish price crossover with Moving Average 20
Type : Bullish
Timeframe : Daily
Bullish price crossover with Moving Average 50
Type : Bullish
Timeframe : Daily
Bullish price crossover with Moving Average 100
Type : Bullish
Timeframe : Daily
Bullish price crossover with adaptative moving average 20
Type : Bullish
Timeframe : Daily
Bullish price crossover with adaptative moving average 50
Type : Bullish
Timeframe : Daily
In fact, 10 technical indicators on 18 studied are currently bullish. But beware of excesses. The Central Indicators scanner currently detects this:
MACD indicator: bullish divergence
Type : Bullish
Timeframe : Daily
Pivot points : price is over resistance 3
Type : Neutral
Timeframe : Daily
RSI indicator is back over 50
Type : Bullish
Timeframe : Daily
Ichimoku : price is over the cloud
Type : Bullish
Timeframe : Daily
Momentum indicator is back over 0
Type : Bullish
Timeframe : Daily
Williams %R indicator is back over -50
Type : Bullish
Timeframe : Daily
The Central Patterns scanner, which studies chart patterns, resistances and supports, has identified these signals:
Near resistance of triangle
Type : Bearish
Timeframe : Daily
Horizontal resistance is broken
Type : Bullish
Timeframe : Daily
No result was found by the Central Candlesticks scanner on Japanese candlesticks.
| S3 | S2 | S1 | Price | R1 | R2 | R3 | |
|---|---|---|---|---|---|---|---|
| ProTrendLines | 56.0 | 56.9 | 59.4 | 59.8 | 60.2 | 61.8 | 65.1 |
| Change (%) | -6.35% | -4.85% | -0.67% | - | +0.67% | +3.34% | +8.86% |
| Change | -3.8 | -2.9 | -0.4 | - | +0.4 | +2.0 | +5.3 |
| Level | Minor | Major | Intermediate | - | Minor | Intermediate | Major |
Pivot points can also be used to set your price objectives. Here is the price situation in relation to pivot points:
| Pivot points | S3 | S2 | S1 | PP | R1 | R2 | R3 |
|---|---|---|---|---|---|---|---|
| Standard | 58.6 | 58.6 | 58.6 | 58.6 | 58.6 | 58.6 | 58.6 |
| Camarilla | 58.6 | 58.6 | 58.6 | 58.6 | 58.6 | 58.6 | 58.6 |
| Woodie | 58.6 | 58.6 | 58.6 | 58.6 | 58.6 | 58.6 | 58.6 |
| Fibonacci | 58.6 | 58.6 | 58.6 | 58.6 | 58.6 | 58.6 | 58.6 |
| Pivot points | S3 | S2 | S1 | PP | R1 | R2 | R3 |
|---|---|---|---|---|---|---|---|
| Standard | 56.7 | 57.5 | 58.7 | 59.5 | 60.7 | 61.5 | 62.7 |
| Camarilla | 59.5 | 59.6 | 59.8 | 60.0 | 60.2 | 60.4 | 60.6 |
| Woodie | 57.0 | 57.6 | 59.0 | 59.6 | 61.0 | 61.6 | 63.0 |
| Fibonacci | 57.5 | 58.2 | 58.7 | 59.5 | 60.2 | 60.7 | 61.5 |
| Pivot points | S3 | S2 | S1 | PP | R1 | R2 | R3 |
|---|---|---|---|---|---|---|---|
| Standard | 51.7 | 54.3 | 56.5 | 59.1 | 61.3 | 63.9 | 66.1 |
| Camarilla | 57.3 | 57.7 | 58.2 | 58.6 | 59.0 | 59.5 | 59.9 |
| Woodie | 51.4 | 54.2 | 56.2 | 59.0 | 61.0 | 63.8 | 65.8 |
| Fibonacci | 54.3 | 56.2 | 57.3 | 59.1 | 61.0 | 62.1 | 63.9 |
Numerical data
The following is the status of the technical indicators and moving averages at the time of publication of this technical analysis:
| RSI (14): | 53.20 | |
| MACD (12,26,9): | 0.0000 | |
| Directional Movement: | 8.0 | |
| AROON (14): | -7.1 | |
| DEMA (21): | 59.3 | |
| Parabolic SAR (0,02-0,02-0,2): | 57.2 | |
| Elder Ray (13): | 0.1 | |
| Super Trend (3,10): | 57.9 | |
| Zig ZAG (10): | 59.8 | |
| VORTEX (21): | 1.0000 | |
| Stochastique (14,3,5): | 38.30 | |
| TEMA (21): | 59.2 | |
| Williams %R (14): | -25.00 | |
| Chande Momentum Oscillator (20): | 0.8 | |
| Repulse (5,40,3): | 1.4000 | |
| ROCnROLL: | 1 | |
| TRIX (15,9): | 0.0000 | |
| Courbe Coppock: | 3.30 |
| MA7: | 59.1 | |
| MA20: | 59.6 | |
| MA50: | 59.0 | |
| MA100: | 59.6 | |
| MAexp7: | 59.2 | |
| MAexp20: | 59.3 | |
| MAexp50: | 59.3 | |
| MAexp100: | 59.6 | |
| Price / MA7: | +1.18% | |
| Price / MA20: | +0.34% | |
| Price / MA50: | +1.36% | |
| Price / MA100: | +0.34% | |
| Price / MAexp7: | +1.01% | |
| Price / MAexp20: | +0.84% | |
| Price / MAexp50: | +0.84% | |
| Price / MAexp100: | +0.34% |
About author
Online


Add a comment
Comments
0 comments on the analysis IMMOB.DASSAULT - Daily