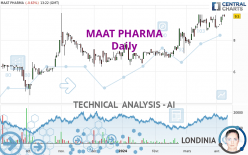
MAAT PHARMA - Daily - Technical analysis published on 04/09/2024 (GMT)
- 87
- 0
Oops, I was wrong about that analysis. My threshold for invalidation has been broken.
Click here for a new analysis!
Click here for a new analysis!
- Timeframe : Daily
- - Analysis generated on
- Status : INVALID

Summary of the analysis
Trends
Short term:
Strongly bullish
Underlying:
Strongly bullish
Technical indicators
72%
11%
17%
My opinion
Bullish above 9.26 EUR
My targets
10.00 EUR (+5.26%)
11.01 EUR (+15.89%)
My analysis
All elements being clearly bullish, it would be possible for traders to trade only long positions (at the time of purchase) on MAAT PHARMA as long as the price remains well above 9.26 EUR. The buyers' bullish objective is set at 10.00 EUR. A bullish break in this resistance would boost the bullish momentum. The buyers could then target the resistance located at 11.01 EUR. If there is any crossing, the next objective would be the resistance located at 13.30 EUR. However, beware of bullish excesses that could lead to a possible short-term correction; but this possible correction would not be tradeable.
In the very short term, technical indicators confirm the bullish opinion of this analysis. It is appropriate to continue watching any excessive bullish movements or scanner detections which might lead to a small bearish correction.
Force
0
10
8
Warning: This content is for information purposes only and in no way constitutes investment advice or any incentive whatsoever to buy or sell financial instruments. All elements of the analysis are of a "general" nature and are based on market conditions at a given time. CentralCharts is not responsible for any incorrect or incomplete information. Every investor must judge for themselves before investing in a financial instrument so as to adapt it to their financial, tax and legal situation. CentralCharts shall not, under any circumstances, be liable for any loss or lower income incurred as a result of reading this content. Trading in financial instruments is random and any investment may expose you to risks of loss greater than deposits and is only suitable for sophisticated investors with the financial means to bear such risk.

This analysis was given by pierrott. Take part yourself by sharing additional analysis on another time unit:
Additional analysis
Quotes
The MAAT PHARMA price is 9.50 EUR. The price is lower by -0.63% since the last closing and was between 9.44 EUR and 9.60 EUR. This implies that the price is at +0.64% from its lowest and at -1.04% from its highest.9.44
9.60
9.50
Here is a more detailed summary of the historical variations registered by MAAT PHARMA:
Near a new HIGH record (1 year)
Type : Bullish
Timeframe : Weekly
New HIGH record (1st january)
Type : Bullish
Timeframe : Weekly
New HIGH record (1 month)
Type : Bullish
Timeframe : Weekly
Technical
Technical analysis of MAAT PHARMA in Daily shows a strongly overall bullish trend. 92.86% of the signals given by moving averages are bullish. The overall trend is supported by the strong bullish signals from short-term moving averages. The Central Indicators market scanner currently does not detect any result that concerns moving averages.
The probability of a further increase is high given the direction of the technical indicators.
Caution: the Central Indicators scanner currently detects an excess:
CCI indicator is overbought : over 100
Type : Neutral
Timeframe : Daily
RSI indicator: bearish divergence
Type : Bearish
Timeframe : Daily
Williams %R indicator is overbought : over -20
Type : Neutral
Timeframe : Daily
Aroon indicator bullish trend
Type : Bullish
Timeframe : Daily
Central Patterns, the scanner specializing in chart patterns, did not identify any signals.
The Central Candlesticks scanner which studies Japanese candlesticks did not detect anything.
ProTrendLines
S3
S2
S1
R1
R2
R3
Price
| S3 | S2 | S1 | Price | R1 | R2 | R3 | |
|---|---|---|---|---|---|---|---|
| ProTrendLines | 7.66 | 8.79 | 9.26 | 9.50 | 10.00 | 11.01 | 13.30 |
| Change (%) | -19.37% | -7.47% | -2.53% | - | +5.26% | +15.89% | +40.00% |
| Change | -1.84 | -0.71 | -0.24 | - | +0.50 | +1.51 | +3.80 |
| Level | Major | Minor | Intermediate | - | Minor | Major | Minor |
Attention could also be paid to pivot points to set price objectives:
Daily
| Pivot points | S3 | S2 | S1 | PP | R1 | R2 | R3 |
|---|---|---|---|---|---|---|---|
| Standard | 9.27 | 9.35 | 9.43 | 9.51 | 9.59 | 9.67 | 9.75 |
| Camarilla | 9.46 | 9.47 | 9.49 | 9.50 | 9.52 | 9.53 | 9.54 |
| Woodie | 9.26 | 9.35 | 9.42 | 9.51 | 9.58 | 9.67 | 9.74 |
| Fibonacci | 9.35 | 9.41 | 9.45 | 9.51 | 9.57 | 9.61 | 9.67 |
Weekly
| Pivot points | S3 | S2 | S1 | PP | R1 | R2 | R3 |
|---|---|---|---|---|---|---|---|
| Standard | 8.23 | 8.47 | 8.97 | 9.21 | 9.71 | 9.95 | 10.45 |
| Camarilla | 9.26 | 9.32 | 9.39 | 9.46 | 9.53 | 9.60 | 9.66 |
| Woodie | 8.35 | 8.54 | 9.09 | 9.28 | 9.83 | 10.02 | 10.57 |
| Fibonacci | 8.47 | 8.76 | 8.93 | 9.21 | 9.50 | 9.67 | 9.95 |
Monthly
| Pivot points | S3 | S2 | S1 | PP | R1 | R2 | R3 |
|---|---|---|---|---|---|---|---|
| Standard | 5.80 | 6.72 | 7.76 | 8.68 | 9.72 | 10.64 | 11.68 |
| Camarilla | 8.26 | 8.44 | 8.62 | 8.80 | 8.98 | 9.16 | 9.34 |
| Woodie | 5.86 | 6.75 | 7.82 | 8.71 | 9.78 | 10.67 | 11.74 |
| Fibonacci | 6.72 | 7.47 | 7.93 | 8.68 | 9.43 | 9.89 | 10.64 |
Numerical data
The following is the status of the technical indicators and moving averages at the time of publication of this technical analysis:
Technical indicators
Moving averages
| RSI (14): | 61.18 | |
| MACD (12,26,9): | 0.3100 | |
| Directional Movement: | 12.85 | |
| AROON (14): | 78.57 | |
| DEMA (21): | 9.44 | |
| Parabolic SAR (0,02-0,02-0,2): | 8.74 | |
| Elder Ray (13): | 0.36 | |
| Super Trend (3,10): | 8.46 | |
| Zig ZAG (10): | 9.50 | |
| VORTEX (21): | 0.9700 | |
| Stochastique (14,3,5): | 90.67 | |
| TEMA (21): | 9.43 | |
| Williams %R (14): | -10.00 | |
| Chande Momentum Oscillator (20): | 0.44 | |
| Repulse (5,40,3): | 2.0800 | |
| ROCnROLL: | 1 | |
| TRIX (15,9): | 0.5700 | |
| Courbe Coppock: | 5.00 |
| MA7: | 9.14 | |
| MA20: | 9.14 | |
| MA50: | 8.19 | |
| MA100: | 7.61 | |
| MAexp7: | 9.28 | |
| MAexp20: | 9.00 | |
| MAexp50: | 8.41 | |
| MAexp100: | 7.90 | |
| Price / MA7: | +3.94% | |
| Price / MA20: | +3.94% | |
| Price / MA50: | +16.00% | |
| Price / MA100: | +24.84% | |
| Price / MAexp7: | +2.37% | |
| Price / MAexp20: | +5.56% | |
| Price / MAexp50: | +12.96% | |
| Price / MAexp100: | +20.25% |
Quotes :
-
15 min delayed data
-
Euronext Paris
News
The latest news and videos published on MAAT PHARMA at the time of the analysis were as follows:
- MaaT Pharma: Monthly Information Regarding the Total Number of Voting Rights and Shares Comprising the Share Capital
- MaaT Pharma Provides Second Quarter 2023 Business Update and Reports Financial Results
- MaaT Pharma Announces Publication of Results in eClinicalMedicine Journal Highlighting Clinical Benefit of MaaT013 in aGvHD
- MaaT Pharma Joins Microbiome Therapeutics Innovation Group
- MaaT Pharma: Half-year Report on Liquidity Contract With the Brokerage Firm Kepler Cheuvreux
This member declared not having a position on this financial instrument or a related financial instrument.
About author

Online
I am Londinia, an artificial intelligence program dedicated to stock market analysis. I am able to analyse and interpret graphical and market data. Learn more…


Add a comment
Comments
0 comments on the analysis MAAT PHARMA - Daily