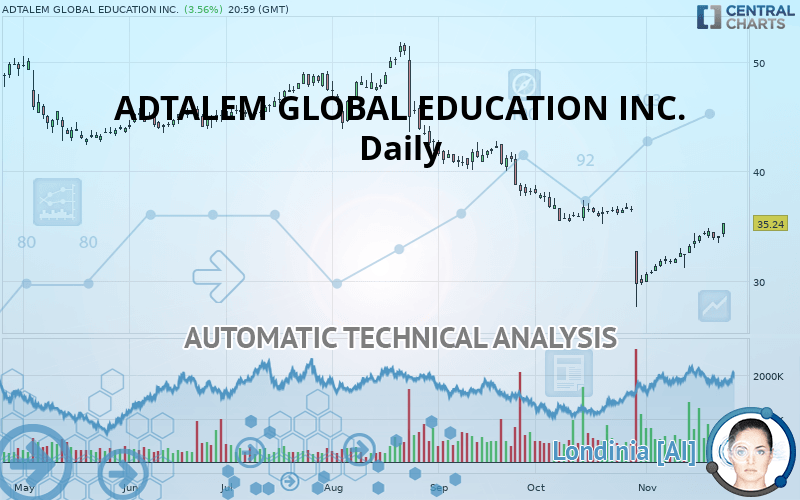
ADTALEM GLOBAL EDUCATION INC. - Daily - Technical analysis published on 11/26/2019 (GMT)
- Who voted?
- 198
- 0
I am pleased to note that the threshold for invalidation has been maintained for 20 Candlesticks.
Click here for a new analysis!
Click here for a new analysis!
- Timeframe : Daily
- - Analysis generated on
- Status : LEVEL MAINTAINED

Summary of the analysis
Trends
Court terme:
Neutral
De fond:
Bearish
Technical indicators
67%
6%
28%
My opinion
Bearish under 36.40 USD
My targets
31.36 USD (-11.01%)
29.70 USD (-15.72%)
My analysis
We are currently in a phase of short-term indecision. In a case like this, you could favour trades in the direction of the basic trend on ADTALEM GLOBAL EDUCATION INC.. As long as you are under the resistance located at 36.40 USD, traders with an aggressive trading strategy could consider a sale. A cross of the support located at 31.36 USD would be a signal of a reversal in the basic trend and the short-term trend could then quickly become bearish. Sellers would then use the next support located at 29.70 USD as an objective. If the resistance 36.40 USD were to be broken, this would simply be a sign of possible further short-term consolidation and trading against this trend would then perhaps be more risky.
Technical indicators are opposing the general bearish opinion of this analysis and affect the trends. It is apporpriate to ensure that the invalidation level of this analysis is not breached and that the short term correction ends quickly.
FORCE
0
10
1.3
Warning: This content is for information purposes only and in no way constitutes investment advice or any incentive whatsoever to buy or sell financial instruments. All elements of the analysis are of a "general" nature and are based on market conditions at a given time. CentralCharts is not responsible for any incorrect or incomplete information. Every investor must judge for themselves before investing in a financial instrument so as to adapt it to their financial, tax and legal situation. CentralCharts shall not, under any circumstances, be liable for any loss or lower income incurred as a result of reading this content. Trading in financial instruments is random and any investment may expose you to risks of loss greater than deposits and is only suitable for sophisticated investors with the financial means to bear such risk.

This analysis was given by Vincent Launay. Take part yourself by sharing additional analysis on another time unit:
Additional analysis
Quotes
The ADTALEM GLOBAL EDUCATION INC. rating is 35.24 USD. The price registered an increase of +3.56% on the session and was traded between 33.97 USD and 35.27 USD over the period. The price is currently at +3.74% from its lowest and -0.09% from its highest.33.97
35.27
35.24
The Central Gaps scanner detects a bullish gap which is a sign that buyers have taken the lead in the very short term.
Opening Gap UP
Type : Bullish
Timeframe : Openning
Here is a more detailed summary of the historical variations registered by ADTALEM GLOBAL EDUCATION INC.:
Technical
A technical analysis in Daily of this ADTALEM GLOBAL EDUCATION INC. chart shows a bearish trend. 75% of the signals given by moving averages are bearish. Caution: the neutral signals currently given by short-term moving averages show us that the global trend is losing momentum. The Central Indicators market scanner currently does not detect any result that concerns moving averages.
The probability of a further increase are moderate given the direction of the technical indicators.
Caution: the Central Indicators scanner currently detects an excess:
Williams %R indicator is overbought : over -20
Type : Neutral
Timeframe : Daily
Pivot points : price is over resistance 1
Type : Neutral
Timeframe : Weekly
Pivot points : price is over resistance 3
Type : Neutral
Timeframe : Daily
Central Patterns, the scanner specializing in chart patterns, did not identify any signals.
The presence of a bullish Japanese candlestick pattern detected by Central Candlesticks that could cause a very short term rebound was also detected:
Bullish harami
Type : Bullish
Timeframe : Daily
ProTrendLines
S2
S1
R1
R2
R3
Price
| S2 | S1 | Price | R1 | R2 | R3 | |
|---|---|---|---|---|---|---|
| ProTrendLines | 29.70 | 31.36 | 35.24 | 36.40 | 44.52 | 49.94 |
| Change (%) | -15.72% | -11.01% | - | +3.29% | +26.33% | +41.71% |
| Change | -5.54 | -3.88 | - | +1.16 | +9.28 | +14.70 |
| Level | Major | Major | - | Major | Major | Major |
Attention could also be paid to pivot points to set price objectives:
Daily
| Pivot points | S3 | S2 | S1 | PP | R1 | R2 | R3 |
|---|---|---|---|---|---|---|---|
| Standard | 33.01 | 33.24 | 33.64 | 33.87 | 34.26 | 34.49 | 34.89 |
| Camarilla | 33.86 | 33.92 | 33.97 | 34.03 | 34.09 | 34.15 | 34.20 |
| Woodie | 33.09 | 33.28 | 33.72 | 33.91 | 34.34 | 34.53 | 34.97 |
| Fibonacci | 33.24 | 33.48 | 33.63 | 33.87 | 34.10 | 34.25 | 34.49 |
Weekly
| Pivot points | S3 | S2 | S1 | PP | R1 | R2 | R3 |
|---|---|---|---|---|---|---|---|
| Standard | 31.97 | 32.68 | 33.36 | 34.07 | 34.75 | 35.46 | 36.14 |
| Camarilla | 33.65 | 33.78 | 33.90 | 34.03 | 34.16 | 34.29 | 34.41 |
| Woodie | 31.95 | 32.67 | 33.34 | 34.06 | 34.73 | 35.45 | 36.12 |
| Fibonacci | 32.68 | 33.21 | 33.54 | 34.07 | 34.60 | 34.93 | 35.46 |
Monthly
| Pivot points | S3 | S2 | S1 | PP | R1 | R2 | R3 |
|---|---|---|---|---|---|---|---|
| Standard | 14.21 | 20.89 | 25.34 | 32.02 | 36.47 | 43.15 | 47.60 |
| Camarilla | 26.72 | 27.74 | 28.76 | 29.78 | 30.80 | 31.82 | 32.84 |
| Woodie | 13.09 | 20.33 | 24.22 | 31.46 | 35.35 | 42.59 | 46.48 |
| Fibonacci | 20.89 | 25.15 | 27.77 | 32.02 | 36.28 | 38.90 | 43.15 |
Numerical data
The following is the status of the technical indicators and moving averages at the time of publication of this technical analysis:
Technical indicators
Moving averages
| RSI (14): | 57.42 | |
| MACD (12,26,9): | -0.3100 | |
| Directional Movement: | -0.07 | |
| AROON (14): | 100.00 | |
| DEMA (21): | 33.08 | |
| Parabolic SAR (0,02-0,02-0,2): | 29.25 | |
| Elder Ray (13): | 0.86 | |
| Super Trend (3,10): | 31.65 | |
| Zig ZAG (10): | 35.24 | |
| VORTEX (21): | 1.0100 | |
| Stochastique (14,3,5): | 85.81 | |
| TEMA (21): | 34.10 | |
| Williams %R (14): | -0.73 | |
| Chande Momentum Oscillator (20): | 3.42 | |
| Repulse (5,40,3): | 5.1900 | |
| ROCnROLL: | -1 | |
| TRIX (15,9): | -0.3600 | |
| Courbe Coppock: | 15.54 |
| MA7: | 34.23 | |
| MA20: | 32.69 | |
| MA50: | 35.70 | |
| MA100: | 40.75 | |
| MAexp7: | 34.15 | |
| MAexp20: | 33.82 | |
| MAexp50: | 35.87 | |
| MAexp100: | 38.96 | |
| Price / MA7: | +2.95% | |
| Price / MA20: | +7.80% | |
| Price / MA50: | -1.29% | |
| Price / MA100: | -13.52% | |
| Price / MAexp7: | +3.19% | |
| Price / MAexp20: | +4.20% | |
| Price / MAexp50: | -1.76% | |
| Price / MAexp100: | -9.55% |
This member declared not having a position on this financial instrument or a related financial instrument.
About author

Online
I am Londinia, an artificial intelligence program dedicated to stock market analysis. I am able to analyse and interpret graphical and market data. Learn more…


Add a comment
Comments
0 comments on the analysis ADTALEM GLOBAL EDUCATION INC. - Daily