INFINITY PHARMACEUTICALS INC. - 15 min. - Technical analysis published on 07/28/2021 (GMT)
- 219
- 0
Click here for a new analysis!
- Timeframe : 15 min.
- - Analysis generated on
- Status : TARGET REACHED

Summary of the analysis
Additional analysis
Quotes
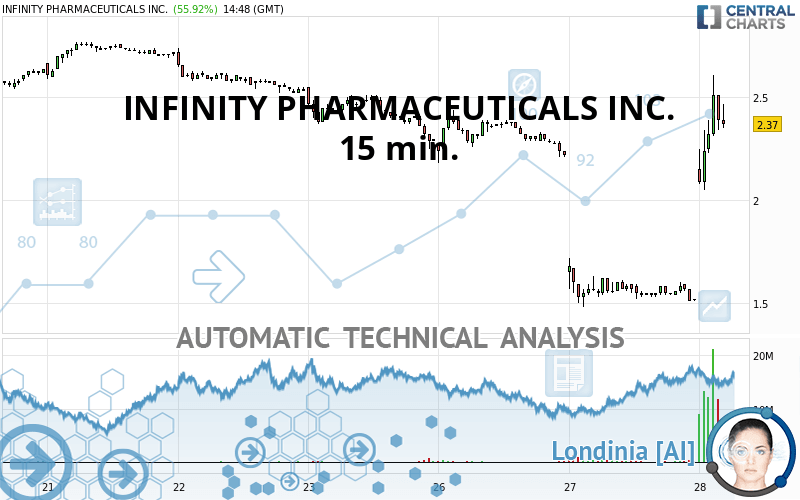
The INFINITY PHARMACEUTICALS INC. rating is 2.37 USD. On the day, this instrument gained +55.92% with the lowest point at 2.05 USD and the highest point at 2.61 USD. The deviation from the price is +15.61% for the low point and -9.20% for the high point.The Central Gaps scanner detects the formation of a bullish gap marking the strong presence of buyers against sellers at the opening. This formed a quotation gap.
Opening Gap UP
Type : Bullish
Timeframe : Openning
A study of price movements over other periods shows the following variations:
Abnormal volumes
Timeframe : 5 days
Abnormal volumes
Timeframe : 20 days
Technical
Technical analysis of this 15 min. chart of INFINITY PHARMACEUTICALS INC. indicates that the overall trend is slightly bullish. Only 53.57% of the signals given by moving averages are bullish. This slightly bullish trend is reinforced by the strong signals currently being given by short-term moving averages. The Central Indicators scanner does not detect any result on moving averages that would impact this trend.
In fact, according to the parameters integrated into the Central Analyzer system, 16 technical indicators out of 18 analysed are currently bullish. Caution: the Central Indicators scanner currently detects an excess:
RSI indicator is overbought : over 80
Type : Neutral
Timeframe : 15 minutes
CCI indicator is overbought : over 100
Type : Neutral
Timeframe : 15 minutes
Previous candle closed over Bollinger bands
Type : Neutral
Timeframe : 15 minutes
Williams %R indicator is overbought : over -20
Type : Neutral
Timeframe : 15 minutes
Pivot points : price is over resistance 3
Type : Neutral
Timeframe : 15 minutes
SuperTrend indicator bullish reversal
Type : Bullish
Timeframe : 15 minutes
Price is back under the pivot point
Type : Bearish
Timeframe : Weekly
No signals are given by Central Patterns, a market scanner specialised in chart patterns, resistances and supports.
Central Candlesticks, the scanner specialised in Japanese candlesticks, detects these signals that could have an impact on the current short-term trend:
Bearish harami
Type : Bearish
Timeframe : 15 minutes
Long white line
Type : Bullish
Timeframe : 15 minutes
| S3 | S2 | S1 | Price | R1 | R2 | R3 | |
|---|---|---|---|---|---|---|---|
| ProTrendLines | 1.48 | 1.72 | 2.33 | 2.37 | 2.55 | 2.77 | 3.00 |
| Change (%) | -37.55% | -27.43% | -1.69% | - | +7.59% | +16.88% | +26.58% |
| Change | -0.89 | -0.65 | -0.04 | - | +0.18 | +0.40 | +0.63 |
| Level | Intermediate | Major | Intermediate | - | Intermediate | Major | Intermediate |
To determine price objectives, it is also possible to use the pivot points. Here is the price position in relation to pivot points:
| Pivot points | S3 | S2 | S1 | PP | R1 | R2 | R3 |
|---|---|---|---|---|---|---|---|
| Standard | 1.19 | 1.33 | 1.43 | 1.57 | 1.67 | 1.81 | 1.91 |
| Camarilla | 1.45 | 1.48 | 1.50 | 1.52 | 1.54 | 1.56 | 1.59 |
| Woodie | 1.16 | 1.32 | 1.40 | 1.56 | 1.64 | 1.80 | 1.88 |
| Fibonacci | 1.33 | 1.43 | 1.48 | 1.57 | 1.67 | 1.72 | 1.81 |
| Pivot points | S3 | S2 | S1 | PP | R1 | R2 | R3 |
|---|---|---|---|---|---|---|---|
| Standard | 1.59 | 1.92 | 2.11 | 2.44 | 2.63 | 2.96 | 3.15 |
| Camarilla | 2.16 | 2.21 | 2.25 | 2.30 | 2.35 | 2.40 | 2.44 |
| Woodie | 1.52 | 1.89 | 2.04 | 2.41 | 2.56 | 2.93 | 3.08 |
| Fibonacci | 1.92 | 2.12 | 2.24 | 2.44 | 2.64 | 2.76 | 2.96 |
| Pivot points | S3 | S2 | S1 | PP | R1 | R2 | R3 |
|---|---|---|---|---|---|---|---|
| Standard | 1.98 | 2.48 | 2.73 | 3.23 | 3.48 | 3.98 | 4.23 |
| Camarilla | 2.78 | 2.85 | 2.92 | 2.99 | 3.06 | 3.13 | 3.20 |
| Woodie | 1.87 | 2.42 | 2.62 | 3.17 | 3.37 | 3.92 | 4.12 |
| Fibonacci | 2.48 | 2.76 | 2.94 | 3.23 | 3.51 | 3.69 | 3.98 |
Numerical data
The following are the details of the technical indicators and moving averages that were collected to generate this technical analysis:
| RSI (14): | 77.66 | |
| MACD (12,26,9): | 0.0600 | |
| Directional Movement: | 40.62 | |
| AROON (14): | 21.43 | |
| DEMA (21): | 1.81 | |
| Parabolic SAR (0,02-0,02-0,2): | 1.67 | |
| Elder Ray (13): | 0.55 | |
| Super Trend (3,10): | 2.08 | |
| Zig ZAG (10): | 2.54 | |
| VORTEX (21): | 1.1800 | |
| Stochastique (14,3,5): | 92.66 | |
| TEMA (21): | 2.15 | |
| Williams %R (14): | -11.81 | |
| Chande Momentum Oscillator (20): | 0.94 | |
| Repulse (5,40,3): | 5.6900 | |
| ROCnROLL: | 1 | |
| TRIX (15,9): | -0.2900 | |
| Courbe Coppock: | 64.21 |
| MA7: | 2.33 | |
| MA20: | 2.63 | |
| MA50: | 2.99 | |
| MA100: | 3.06 | |
| MAexp7: | 2.16 | |
| MAexp20: | 1.77 | |
| MAexp50: | 1.89 | |
| MAexp100: | 2.10 | |
| Price / MA7: | +1.72% | |
| Price / MA20: | -9.89% | |
| Price / MA50: | -20.74% | |
| Price / MA100: | -22.55% | |
| Price / MAexp7: | +9.72% | |
| Price / MAexp20: | +33.90% | |
| Price / MAexp50: | +25.40% | |
| Price / MAexp100: | +12.86% |
News
Don't forget to follow the news on INFINITY PHARMACEUTICALS INC.. At the time of publication of this analysis, the latest news was as follows:
- Thinking about buying stock in TAL Education, Obseva SA, Gaotu Techedu, Sirius XM, or Infinity Pharmaceuticals?
- Infinity Pharmaceuticals Presents Updated Data from Phase 2 MARIO-275 Trial in Urothelial Cancer (UC) and Phase 2 MARIO-3 Trial in Triple Negative Breast Cancer (TNBC)
- Infinity Pharmaceuticals Reports Second Quarter 2021 Financial Results and Provides Company Update
- Infinity Pharmaceuticals Hosting Webinar on MARIO-3 and MARIO-275 Phase 2 Trials
- Infinity Pharmaceuticals Reports First Quarter 2021 Financial Results and Provides Company Update
About author

Online


Add a comment
Comments
0 comments on the analysis INFINITY PHARMACEUTICALS INC. - 15 min.