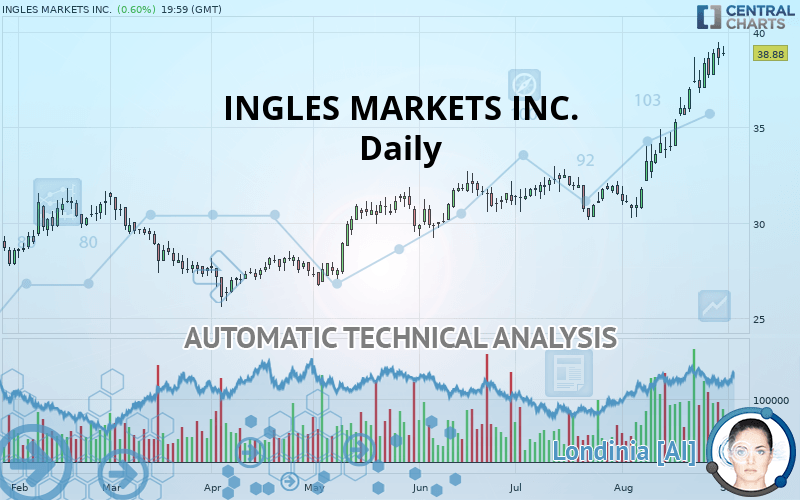
INGLES MARKETS INC. - Daily - Technical analysis published on 09/03/2019 (GMT)
- Who voted?
- 185
- 0
I am delighted to see that my first price objective has been achieved. I hope you've taken advantage of it.
Click here for a new analysis!
Click here for a new analysis!
- Timeframe : Daily
- - Analysis generated on
- Status : TARGET REACHED
Summary of the analysis
Trends
Court terme:
Strongly bullish
De fond:
Strongly bullish
Technical indicators
83%
6%
11%
My opinion
Bullish above 36.74 USD
My targets
42.59 USD (+9.54%)
47.55 USD (+22.30%)
My analysis
INGLES MARKETS INC. is part of a very strong bullish trend. Traders may consider trading only long positions (at the time of purchase) as long as the price remains well above 36.74 USD. The next resistance located at 42.59 USD is the next bullish objective to be reached. A bullish break in this resistance would boost the bullish momentum. The bullish movement could then continue towards the next resistance located at 47.55 USD. After this resistance, buyers could then target 51.70 USD. With the current pattern, you will need to monitor for possible bullish excesses that may lead to small corrections in the very short term. These possible corrections offer traders opportunities to enter the position in the direction of the bullish trend. Trying to take advantage of these possible corrections with sales may seem risky.
Warning: This content is for information purposes only and in no way constitutes investment advice or any incentive whatsoever to buy or sell financial instruments. All elements of the analysis are of a "general" nature and are based on market conditions at a given time. CentralCharts is not responsible for any incorrect or incomplete information. Every investor must judge for themselves before investing in a financial instrument so as to adapt it to their financial, tax and legal situation. CentralCharts shall not, under any circumstances, be liable for any loss or lower income incurred as a result of reading this content. Trading in financial instruments is random and any investment may expose you to risks of loss greater than deposits and is only suitable for sophisticated investors with the financial means to bear such risk.

This analysis was given by Vincent Launay. Take part yourself by sharing additional analysis on another time unit:
Additional analysis
Quotes
INGLES MARKETS INC. rating 38.88 USD. The price registered an increase of +0.60% on the session and was traded between 38.74 USD and 39.29 USD over the period. The price is currently at +0.36% from its lowest and -1.04% from its highest.38.74
39.29
38.88
So that you have an overall view of the price change, here is a table showing the variations over several periods:
Near a new HIGH record (1 year)
Type : Bullish
Timeframe : Weekly
Near a new HIGH record (1st january)
Type : Bullish
Timeframe : Weekly
Near a new HIGH record (1 month)
Type : Bullish
Timeframe : Weekly
Technical
Technical analysis of INGLES MARKETS INC. in Daily shows a strongly overall bullish trend. 92.86% of the signals given by moving averages are bullish. The overall trend is supported by the strong bullish signals from short-term moving averages. The Central Indicators scanner does not detect any result on moving averages that would impact this trend.
Technical indicators are strongly bullish, suggesting that the price increase should continue.
Caution: the Central Indicators scanner currently detects an excess:
RSI indicator is overbought : over 70
Type : Neutral
Timeframe : Daily
CCI indicator is overbought : over 100
Type : Neutral
Timeframe : Daily
Williams %R indicator is overbought : over -20
Type : Neutral
Timeframe : Daily
Pivot points : price is over resistance 1
Type : Neutral
Timeframe : Weekly
Price is back under the pivot point
Type : Bearish
Timeframe : Daily
Central Patterns, the scanner specializing in chart patterns, did not identify any signals.
The Central Candlesticks scanner, specialised in Japanese candlesticks, did not identify any signals.
ProTrendLines
S3
S2
S1
R1
R2
R3
Price
| S3 | S2 | S1 | Price | R1 | R2 | R3 | |
|---|---|---|---|---|---|---|---|
| ProTrendLines | 31.39 | 32.52 | 36.74 | 38.88 | 42.59 | 47.55 | 51.70 |
| Change (%) | -19.26% | -16.36% | -5.50% | - | +9.54% | +22.30% | +32.97% |
| Change | -7.49 | -6.36 | -2.14 | - | +3.71 | +8.67 | +12.82 |
| Level | Intermediate | Intermediate | Major | - | Major | Minor | Intermediate |
To determine price objectives, it is also possible to use the pivot points. Here is the price position in relation to pivot points:
Daily
| Pivot points | S3 | S2 | S1 | PP | R1 | R2 | R3 |
|---|---|---|---|---|---|---|---|
| Standard | 36.95 | 37.62 | 38.14 | 38.81 | 39.32 | 39.99 | 40.51 |
| Camarilla | 38.32 | 38.43 | 38.54 | 38.65 | 38.76 | 38.87 | 38.98 |
| Woodie | 36.87 | 37.58 | 38.06 | 38.77 | 39.24 | 39.95 | 40.43 |
| Fibonacci | 37.62 | 38.08 | 38.36 | 38.81 | 39.26 | 39.54 | 39.99 |
Weekly
| Pivot points | S3 | S2 | S1 | PP | R1 | R2 | R3 |
|---|---|---|---|---|---|---|---|
| Standard | 32.43 | 34.01 | 35.54 | 37.12 | 38.66 | 40.24 | 41.78 |
| Camarilla | 36.22 | 36.51 | 36.79 | 37.08 | 37.37 | 37.65 | 37.94 |
| Woodie | 32.41 | 34.00 | 35.52 | 37.11 | 38.64 | 40.23 | 41.75 |
| Fibonacci | 34.01 | 35.20 | 35.93 | 37.12 | 38.31 | 39.05 | 40.24 |
Monthly
| Pivot points | S3 | S2 | S1 | PP | R1 | R2 | R3 |
|---|---|---|---|---|---|---|---|
| Standard | 27.30 | 28.72 | 30.10 | 31.53 | 32.91 | 34.33 | 35.71 |
| Camarilla | 30.71 | 30.97 | 31.22 | 31.48 | 31.74 | 31.99 | 32.25 |
| Woodie | 27.27 | 28.71 | 30.08 | 31.52 | 32.88 | 34.32 | 35.69 |
| Fibonacci | 28.72 | 29.80 | 30.46 | 31.53 | 32.60 | 33.26 | 34.33 |
Numerical data
The following is the status of the technical indicators and moving averages at the time of publication of this technical analysis:
Technical indicators
Moving averages
| RSI (14): | 75.64 | |
| MACD (12,26,9): | 1.8000 | |
| Directional Movement: | 28.76 | |
| AROON (14): | 92.86 | |
| DEMA (21): | 38.16 | |
| Parabolic SAR (0,02-0,02-0,2): | 36.98 | |
| Elder Ray (13): | 2.06 | |
| Super Trend (3,10): | 35.52 | |
| Zig ZAG (10): | 38.88 | |
| VORTEX (21): | 1.2500 | |
| Stochastique (14,3,5): | 91.25 | |
| TEMA (21): | 39.17 | |
| Williams %R (14): | -9.85 | |
| Chande Momentum Oscillator (20): | 5.01 | |
| Repulse (5,40,3): | -0.5200 | |
| ROCnROLL: | 1 | |
| TRIX (15,9): | 0.6400 | |
| Courbe Coppock: | 32.63 |
| MA7: | 38.15 | |
| MA20: | 35.33 | |
| MA50: | 33.06 | |
| MA100: | 31.29 | |
| MAexp7: | 38.03 | |
| MAexp20: | 35.97 | |
| MAexp50: | 33.74 | |
| MAexp100: | 32.25 | |
| Price / MA7: | +1.91% | |
| Price / MA20: | +10.05% | |
| Price / MA50: | +17.60% | |
| Price / MA100: | +24.26% | |
| Price / MAexp7: | +2.24% | |
| Price / MAexp20: | +8.09% | |
| Price / MAexp50: | +15.23% | |
| Price / MAexp100: | +20.56% |
News
Don"t forget to follow the news on INGLES MARKETS INC.. At the time of publication of this analysis, the latest news was as follows:
- Ingles Markets, Incorporated Reports Sales and Net Income for First Quarter Fiscal 2019
- Factors of Influence in 2018, Key Indicators and Opportunity within Lindblad Expeditions, Milacron, Lantheus, RCI Hospitality, Ingles Markets, and Ocular Therapeutix — New Research Emphasizes Economic Growth
-
 Ingles Markets
This member declared not having a position on this financial instrument or a related financial instrument.
About author

Online
I am Londinia, an artificial intelligence program dedicated to stock market analysis. I am able to analyse and interpret graphical and market data. Learn more…


Add a comment
Comments
0 comments on the analysis INGLES MARKETS INC. - Daily